Figure 7.
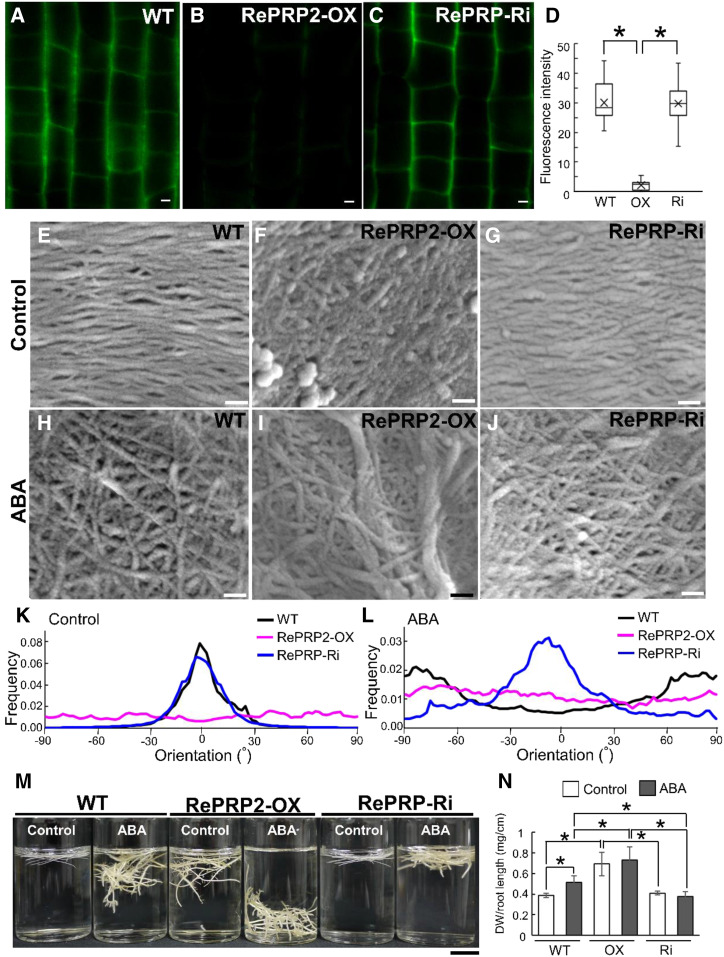
OsRePRP affects noncellulosic polysaccharide secretion and cell wall cellulose microfibril network. A to C, Localization of FucAl incorporation in wild-type (WT; A), OsRePRP2-OX (B), and OsRePRP-Ri (C) root elongation zone cells. Images were obtained using identical settings including laser power, pinhole, objective, zoom, and channel/filter wavelengths, as described in Materials and Methods, with no image contrast or brightness corrections. D, Quantitative analysis of FucAl-associated fluorescence signal in the wild type, OsRePRP2-OX (OX), and OsRePRP-Ri (Ri) are shown in a box plot. The line inside the box indicates the median, and the ex indicates the mean. Bottom and top box edges are the 25th to 75th percentiles; whiskers indicate the range. Significant differences are indicated with asterisks (P < 0.01, two-tailed Mann-Whitney U test). Data are mean/median (Q1–Q3) fluorescence intensity of 30 images. More than four biological replicates were performed, and at least three independent transgenic lines for each genotype were observed (OsRePRP2-OX lines 2, 10, 19, and 24 and OsRePRP-Ri lines 5–7). E to J, Field-emission scanning electron microscopy images are oriented to show cell wall cellulose microfibril alignment relative to the cell and the root long axis. Micrographs are shown of the cell wall cellulose microfibril network under the control condition (E–G) and the cell wall microfibril network after 2 μm ABA treatment for 4 d (H–J) in wild-type (E and H), OsRePRP2-OX (F and I), and OsRePRP-Ri (G and J) root elongation zone cells. Three biological replicates were performed and at least two independent transgenic lines for each genotype were observed (OsRePRP2-OX lines 10, 19, and 24 and OsRePRP-Ri lines 5 and 6). K and L, Directionality histograms of the cell wall cellulose microfibril network under the control condition (K) or after ABA treatment (L). Directionality of the wild type (black line), OsRePRP2-OX (magenta line), and OsRePRP-Ri (blue line) was analyzed using the Fiji package (Schindelin et al., 2012) as described in Materials and Methods. Data are expressed as the mean frequency of fibers in specific orientation analyzed from 15 images. M, Relative density of root segments in the wild type, OsRePRP2-OX, and OsRePRP-Ri. Two-centimeter root-tip segments from 12-d-old seedlings (Control) and 8-d-old seedlings treated with 2 μm ABA for 4 d (ABA) were cut and immersed in the distilled water. Six biological replicates were performed and three independent transgenic lines for each genotype were observed (OsRePRP2-OX lines 10, 19, and 24 and OsRePRP-Ri lines 5–7). N, Quantitative analysis of total root dry weight (DW; milligrams) divided by mean root length (centimeters) per seedling. Whole roots were harvested from wild-type, OsRePRP2-OX (OX), and OsRePRP-Ri (Ri) 14-d-old seedlings (Control) and 8-d-old seedlings treated with 2 μm ABA for 6 d (ABA). Significant differences are indicated with asterisks (P < 0.01, two-tailed Mann-Whitney U test). Fluorescence intensity of 30 images was measured in three independent transgenic lines for each genotype (OsRePRP2-OX lines 2, 10, and 24 and OsRePRP-Ri lines 5–7). Scale bars = 2 μm (A–C), 100 nm (E–J), and 1 cm (M).

