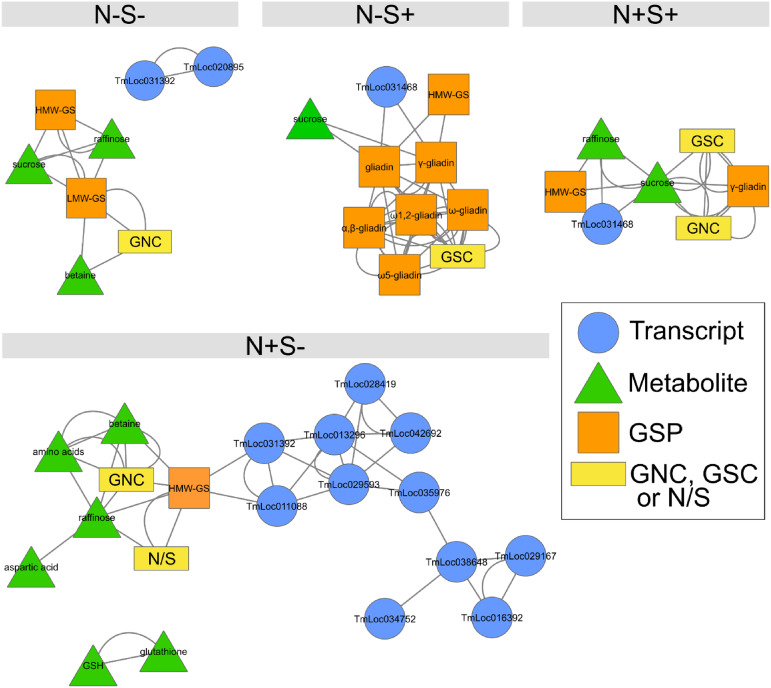
Figure 5.
Effects of N and S treatments on the coaccumulation of GSPs, metabolites, and sulfur-deficiency-responsive transcripts. Data for the 24 transcripts upregulated in response to S deficiency, as highlighted in Figure 4B, the 24 significant metabolites, the mass per grain of N (GNC) and S (GSC), GSPs, and the grain N-to-S ratio (N:S) were used to analyze their coaccumulation by treatment, from 300°Cd to 600°Cd after anthesis. Edges between nodes represent coaccumulation links. GSH, reduced glutathione.

