Figure 7.
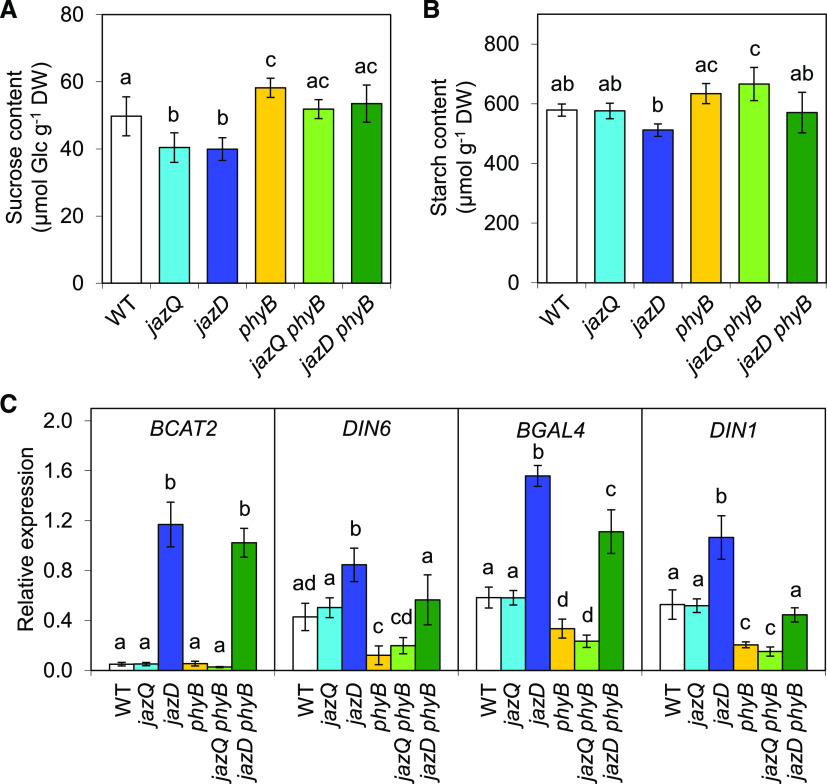
Symptoms of carbon limitation are partially recovered in the jazD phyB mutant. A and B, End-of-day starch (A) and Suc (B) levels in shoots of the indicated genotypes. Bars show the means ± sd (n = 5 plants per genotype). DW, Dry weight; WT, wild type. C, Expression level of sugar-starvation marker genes in shoot tissues of the indicated genotypes. mRNA levels were measured by RT-qPCR and normalized to the reference gene PP2a. Bars depict the means ± sd (n = 4 plants per genotype). Different letters represent a significant difference at P < 0.05 with Tukey’s HSD mean-separation test.

