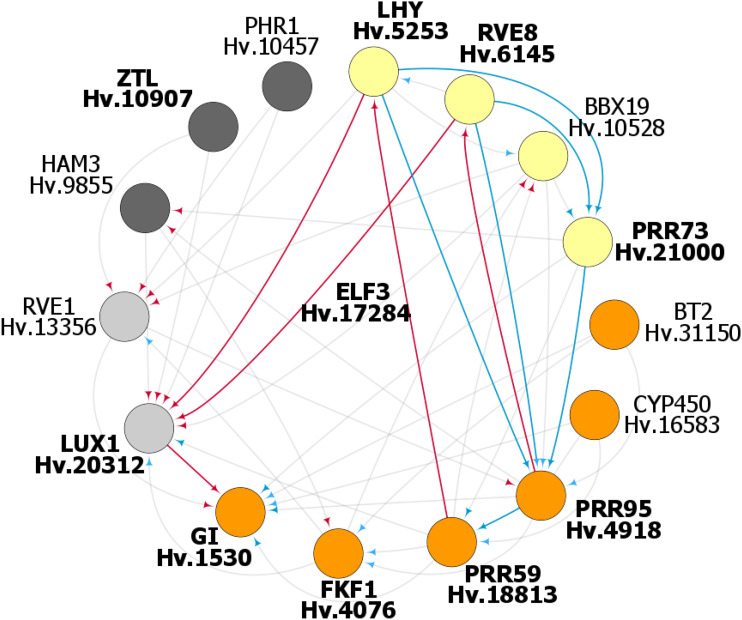
Figure 4.
The putative circadian network of the barley oscillator as predicted from time series expression data. Genetic evidence but no model prediction allowed placing HvELF3 as a core clock component. The figure displays the inferred components and interactions that constitute the barley circadian transcriptional network (also see Supplemental Information). Circadian clock components are represented by circles and sorted in clockwise direction for the time point of peak expression starting with HvLHY at dawn (yellow, morning; orange, evening; gray, night). The regulatory interactions are represented by directional arrows, where activation is marked in blue and inhibition in red. The components printed in bold and the links highlighted in color are consistent with key components and key regulatory principles present in circadian clock models from Arabidopsis.

