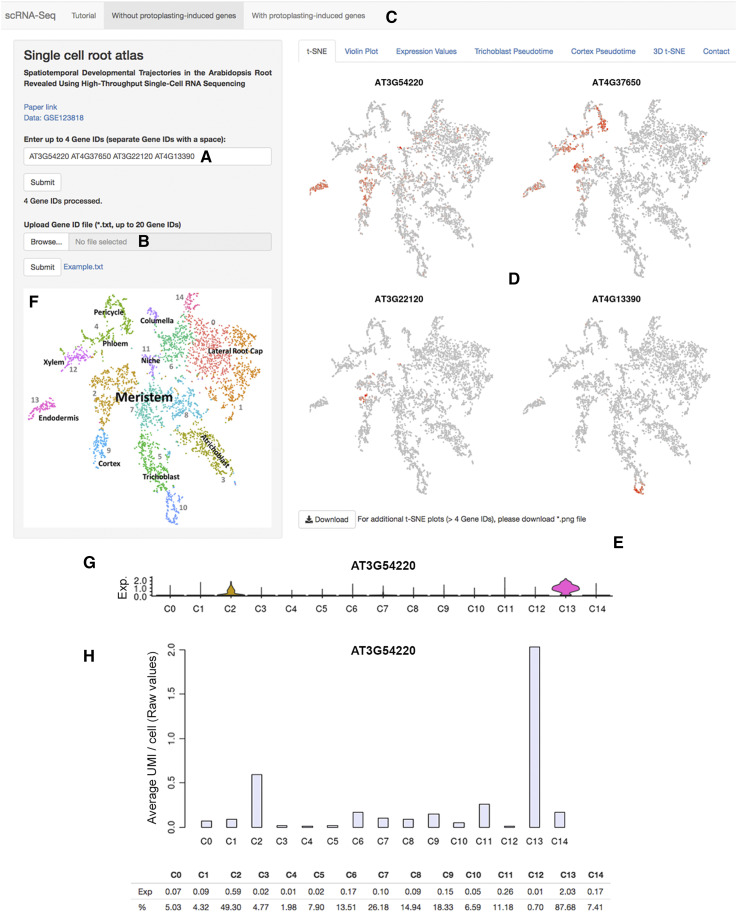
Figure 1.
The scRNA-Seq Browser interface. A, Individual genes (up to four genes) can be queried. B, Alternately, a gene list (up to 20 genes) can be uploaded. C, Data sets that include or exclude genes induced by the protoplasting procedure can be queried. D, For genes detected in a data set, t-SNE plots are displayed showing expression across the clusters of cells. This can be localized to a defined subset of cells within a cluster. E, t-SNE plots are downloadable as a .png file. F, Basic cluster maps aid with quick initial interpretation. G, Gene expression values across clusters can be visualized as violin plots depicting the distribution of cells with a given expression value in each cluster. The y axis shows the gene expression level, and the x axis represents the proportion of cells showing a given expression value. H, In addition, histograms showing mean expression per cell for a given gene across clusters, either as raw UMI (unique molecular identifier) counts or as Seurat-normalized data (not shown here), and percentages of cells expressing, are displayed. Violin plots are downloadable as .png files and expression data as comma-separated files. C, Cluster; corresponding cluster identities are shown in F.

