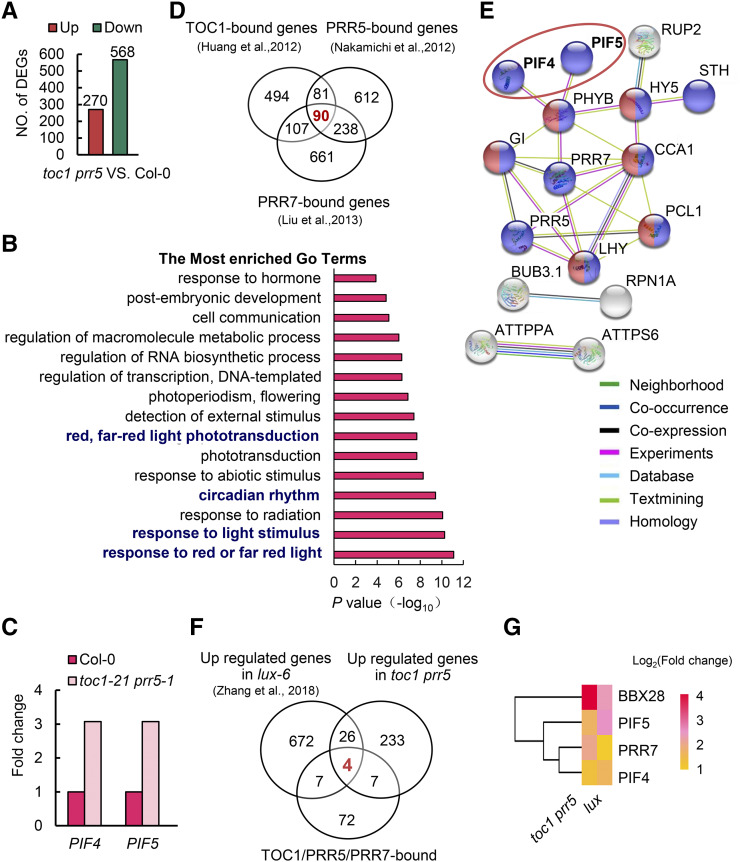
Figure 3.
PIF4 and PIF5 are potential direct transcriptional targets of TOC1 and PRR5. A, DEGs between the toc1 prr5 mutant and wild-type Col-0 in RNA-seq. The samples were harvested at ZT15 from 10-d-old seedlings grown in 12-h-light/12-h-dark photocycles. B, GO analysis of the overlapping genes between upregulated DEGs in the toc1 prr5 mutant and the genes bound by TOC1. C, Expression profiles of PIF4 and PIF5 in the toc1 prr5 mutant. Data from RNA-seq. D, Venn diagram showing the number of common genes bound by TOC1, PRR5, and PRR7. E, Protein interaction network analysis of the 90 genes co-bound by TOC1, PRR5, and PRR7 in D using the STRING database (http://string-db.org/), showing a major cluster including PIF4, PIF5, and other known circadian core components. Colored nodes represent query proteins and the first shell of interactors, white nodes the second shell of interactors, empty nodes the proteins of unknown 3D structure, and solid nodes proteins for which some 3D structure is known or predicted. Edges represent protein-protein associations taken from curated databases (light blue) or determined by experiment (magenta), gene neighborhood (green), gene co-occurrence (dark blue), text mining (light green), coexpression (black), or protein homology (light purple). F, Venn diagram showing the number of overlapping genes among the TOC1, PRR5, and PRR7 cobound genes, upregulated DEGs in the toc1 prr5 mutant, and upregulated DEGs in the lux-6 mutant. G, Heat map showing four common cotargets in upregulated DEGs in toc1 prr5 and lux-6 mutants. The scale represents the log2 (fold change).

