Figure 4.
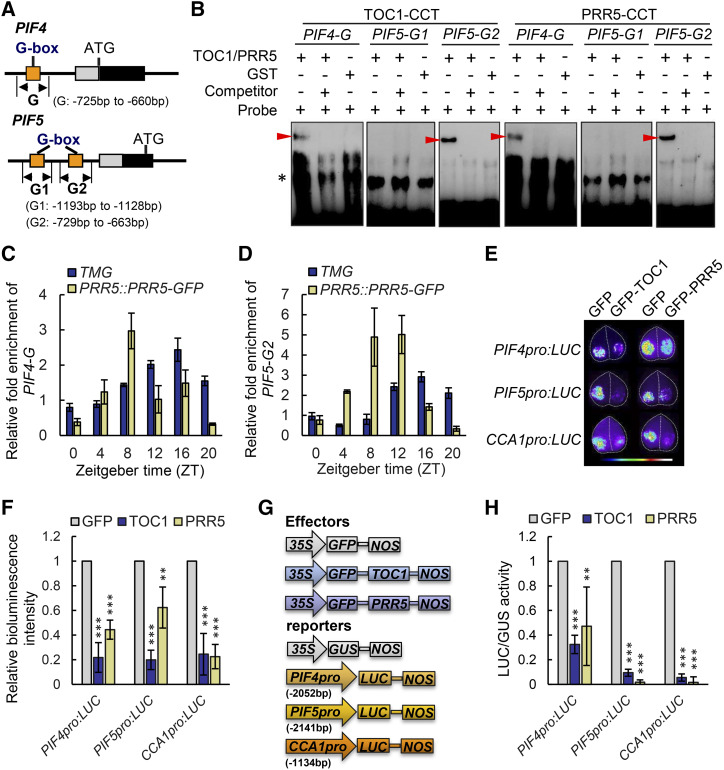
TOC1 and PRR5 directly bind the PIF4 and PIF5 promoters to repress their transcription. A, Schematic diagram of the promoter regions of PIF4 and PIF5. Orange boxes represent the putative G-box elements. G, G1, and G2 represent the respective DNA fragments used for generating EMSA probes and ChIP-qPCR detection. B, EMSA with the CCT domain of TOC1 and PRR5 incubated with a probe designed for the PIF4-G, PIF5-G1, and PIF5-G2 regions of the PIF4 and PIF5 genes as shown in A, and the 100-fold unlabeled competitor. GST alone was used as a negative control. Arrowheads mark the shifted bands. C and D, Time-course ChIP-qPCR assay showing that TOC1 and PRR5 bind to the PIF4-G (C) and PIF5-G2 (D) regions diurnally, which was well associated with their respective protein abundances. Data are the means ± sd. E, Transient transcriptional expression analysis showing that PIF4 and PIF5 were repressed by TOC1 and PRR5 in epidermal cells of N. benthamiana leaves. CCA1pro:LUC was used as a positive control. Data are representative of three biological replicates with similar results. Leaf images were digitally abstracted and multiple images were made into a composite for comparison. F, Quantification of bioluminescence intensity as shown in E. Data are the means ± sd. Asterisks denote statistically significant difference among means: *P < 0.05, **P < 0.01, and ***P < 0.001, determined by Student’s t test. G and H, Transient transcriptional expression assay in Arabidopsis protoplasts showing a schematic diagram of the effector and reporter vectors (G) and respective quantification of relative LUC/GUS activity (H). The relative LUC/GUS activity in protoplasts cotransformed with GFP and reporter vector was defined as one. CCA1pro:LUC was used as a positive control, while 35S:GUS was used as an internal control. Data are the means ± sd. Asterisks in H denote statistically significant differences among means: *P < 0.05, **P < 0.01, and ***P < 0.001 by Student’s t test.

