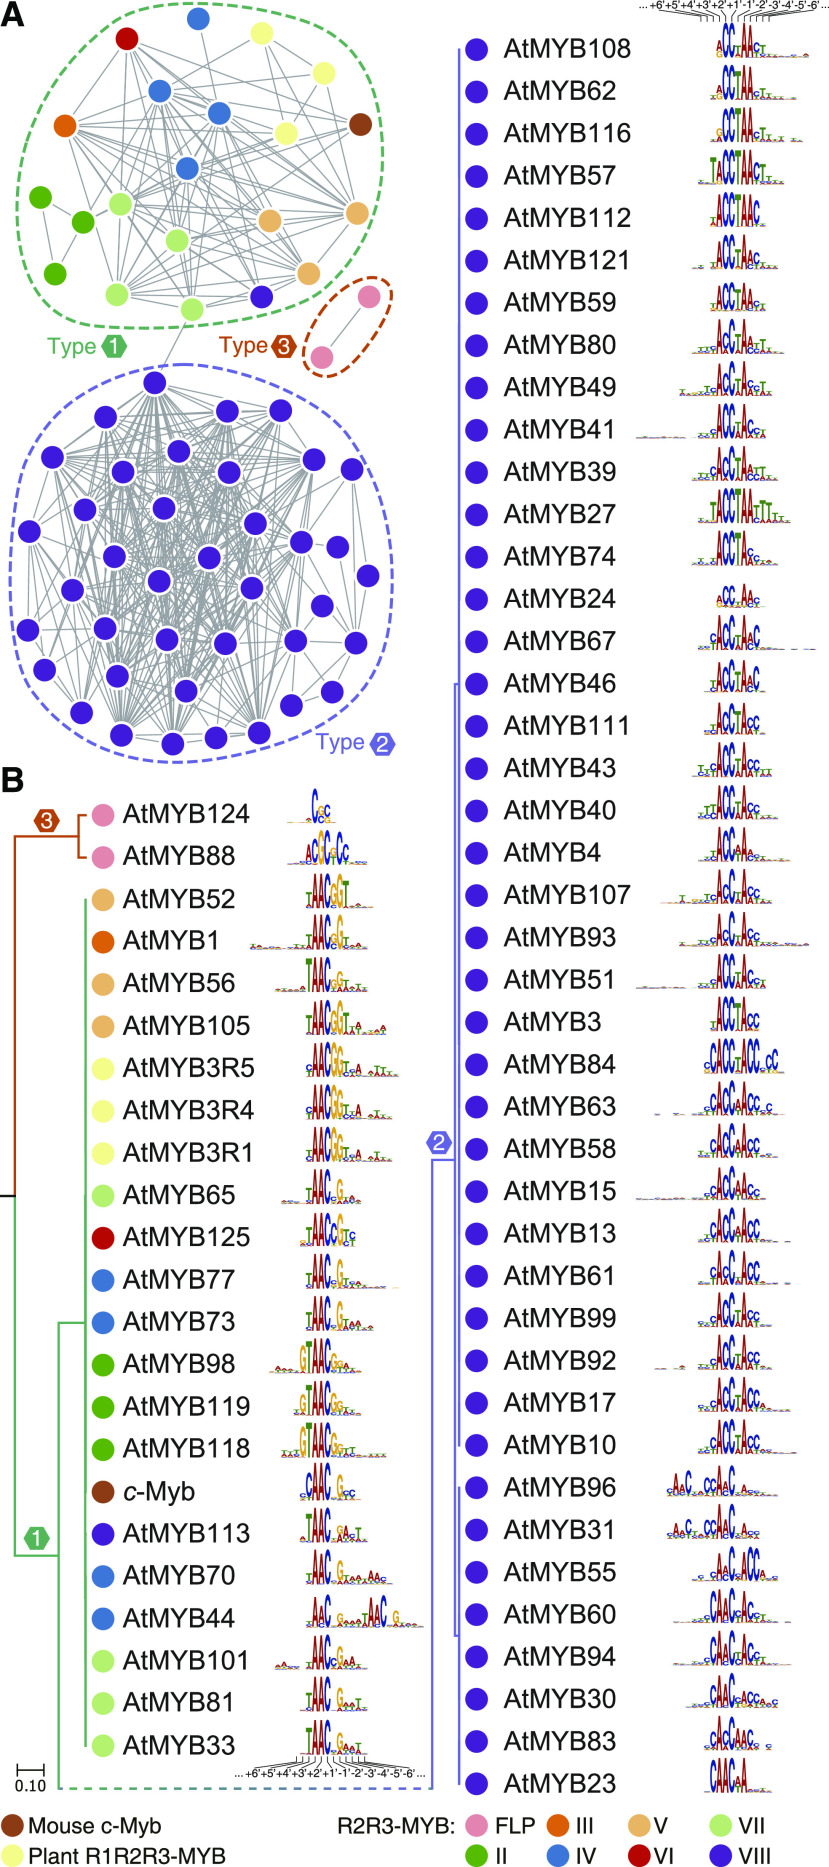
Figure 7.
Classification of the primary DNA-binding specificities of mouse c-Myb and MYB proteins from Arabidopsis. A, Network graph of the pairwise similarities of DNA-binding specificities of MYB proteins. The nodes represent the DNA-binding specificity of the MYB proteins, and the edges represent pairwise similarities (S) >1.5e−4. Dashed rings indicate clusters of binding specificities. B, DNA-binding specificities of MYB TFs clustered in the UPGMA tree. Notably, the UPGMA tree is rooted at the midpoint, and the topology does not indicate the evolutionary history of the DNA-binding specificities. The numbers indicate the position of a base in the DNA-binding profile (Solano et al., 1997). The color of the nodes in A and B indicates the source of the MYB protein.

