
Figure 5.2.
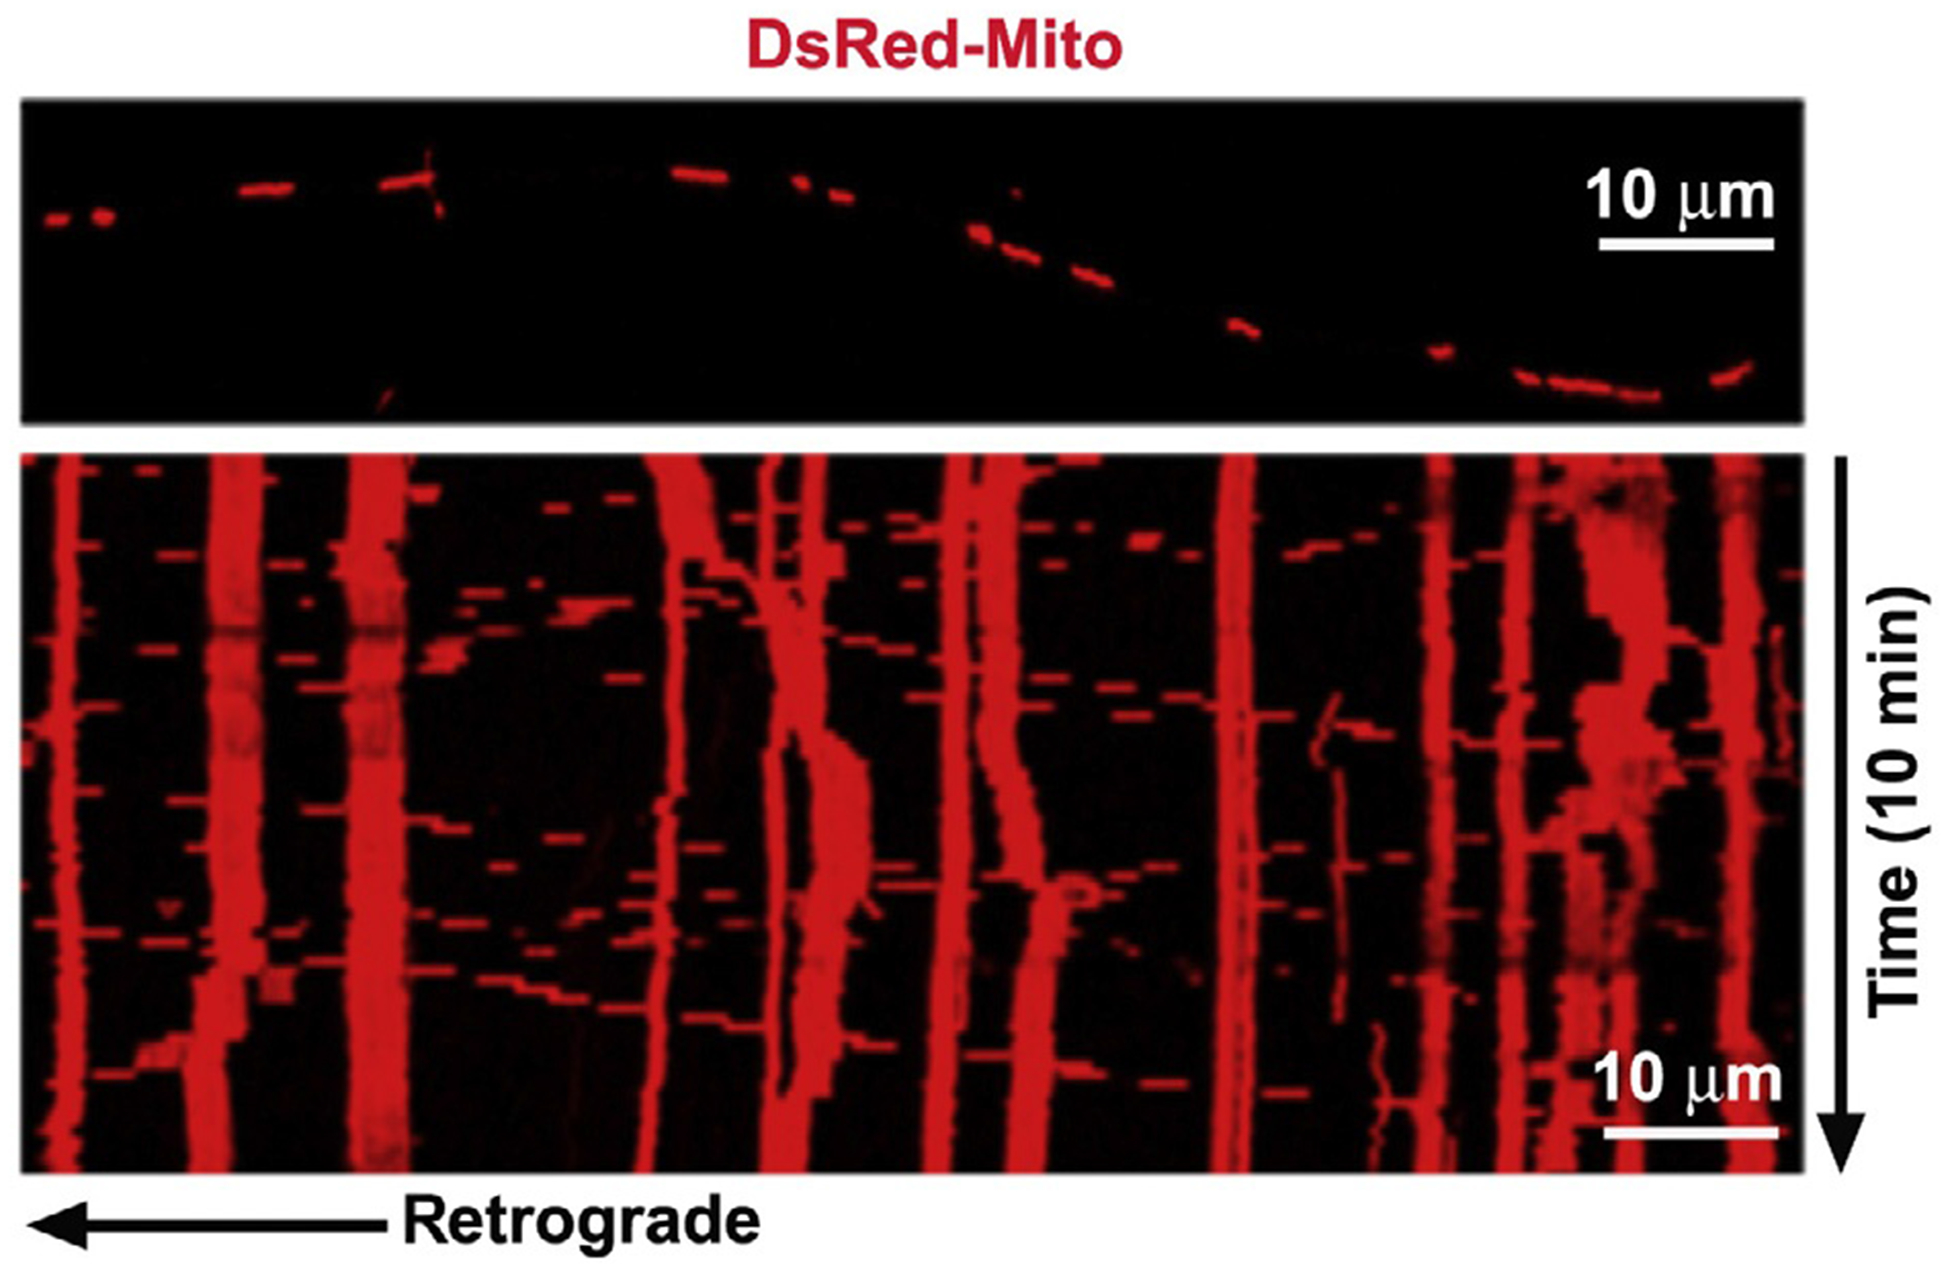
Analysis of mitochondrial motility. Representative axonal image shows DsRed-labeled mitochondria (upper), and the corresponding time-lapse imaging of mitochondrial movement is converted into kymograph (lower). In kymographs, vertical lines represent stationary mitochondria, while slanted or curved lines indicate mobile mitochondria. To quantify relative motility, a mitochondrion is considered stationary if it remained immotile (displacement ≤5 μm) during the entire recording period (10 min). The total number of mitochondria is defined as the number of mitochondria in each frame.