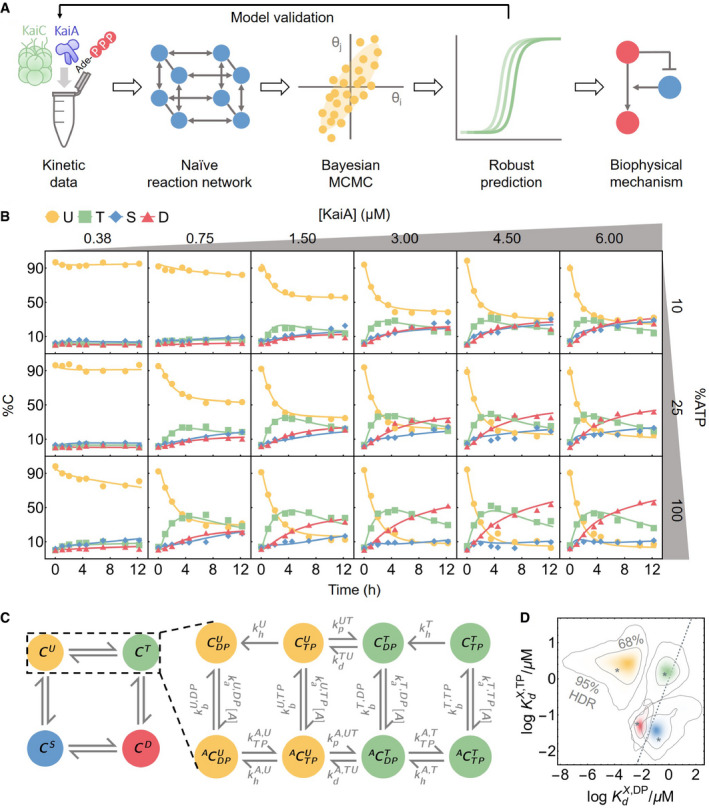
Figure 1. Phosphorylation data are fit by a mechanistically naive kinetic model.

- An outline of the data‐driven Bayesian model fitting approach employed in this work.
- To constrain the model, measurements of KaiC phosphorylation kinetics were collected at six [KaiA] and three %ATP conditions. The curves represent the best fit model prediction.
- A schematic of the mass‐action kinetics model. The model elaborates on the autophosphorylation reactions of KaiC by explicitly keeping track of the time evolution of the KaiC phosphoforms and nucleotide‐bound states; conversions among these states are mediated by phosphotransfer, nucleotide exchange, ATP hydrolysis, and KaiA (un)binding. Note that the KaiA binding reactions are second‐order, but KaiA concentration ([A]) is written as part of the effective first‐order rate constant. See the main text for a discussion of the state and rate constant nomenclature and Fig EV1A for a schematic of the full model.
- The posterior distributions for log KaiA dissociation constants (base 10). The horizontal axis represents the affinity for ADP‐bound KaiC, and the vertical axis represents the affinity for ATP‐bound KaiC; X ∈ {U, T, S, D} and corresponds to the four colors of the KaiC phosphoforms, as in panel C. The asterisks represent the best fit, and the contour lines represent the 95% and 68% highest posterior density regions (HDR). The dashed line represents the line, so that densities above the line indicate higher affinity for the ADP‐bound states and densities below the line indicate higher affinity for the ATP‐bound states.
Source data are available online for this figure.
