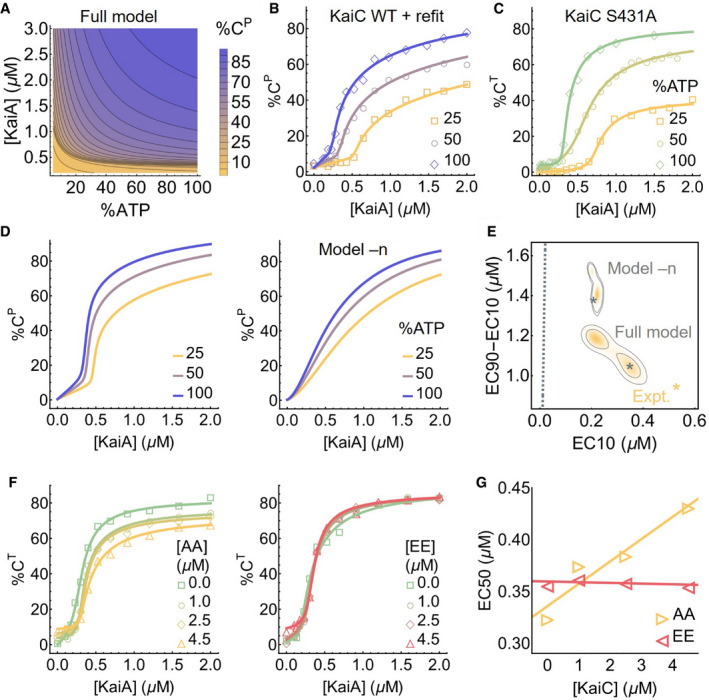
Figure 3. Substrate competition explains KaiC phosphorylation ultrasensitivity.

- The predicted stimulus–response relation of the total steady‐state KaiC phosphorylation level as a function of %ATP and [KaiA].
- Experimentally determined stimulus–response function of KaiC at three %ATP conditions; the curves are based on refitting the best fit of the full model to the steady‐state measurements.
- Similar to B, but for KaiC S431A, which has only one phosphorylation site; the curves are based on independent fits to a simple phenomenological substrate competition model.
- Cross sections of the stimulus–response relation at three %ATP, computed using the full model (left) and model –n (right).
- Posterior distributions for the shape measures of the stimulus–response functions at 25% ATP predicted by the full model and model –n. The contours represent the 68% and 95% HDRs, and the gray stars represent the model best fits. The shapes of the stimulus–response functions are quantified using two metrics: EC10, which quantifies threshold‐like behavior, and EC90–EC10, which quantifies switch‐like behavior. The shape measures of the experimentally determined stimulus–response function at 25% ATP is shown as the yellow star. The dashed line represents (EC10, EC90–EC10) = (K/9, 80K/9), which characterizes the shape of a hyperbolic stimulus–response function [A]/(K + [A]) that has no switching or thresholding.
- The stimulus–response functions of KaiC S431A at 100% ATP in the presence of KaiC S431A/T432A (AA; left) and S431E/T432E (EE; right) phosphomimetic mutants to probe the effect of kinetic competition on KaiC phosphorylation.
- The relations between EC50 (the midpoint of a stimulus–response function) and KaiC AA/EE concentrations quantified using the curves shown in (F).
Source data are available online for this figure.
