
Figure EV3. The metabolic compensation property of the Kai oscillator.
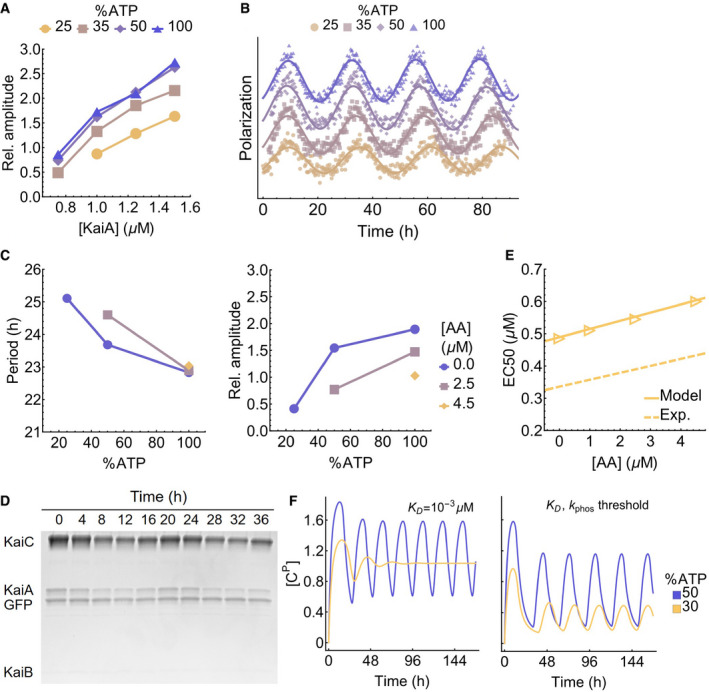
- Fluorescence polarization measurements of oscillatory reactions at various [KaiA] and %ATP are fit to curves of the form FP (t) = A cos (2πT −1 t + ϕ) + bt + c to extract the normalized amplitude (100A/c; dimensionless) of the oscillator; see Fig 2D for the periods (T) of the same reactions. Reactions with an amplitude A < 0.5 are considered to be non‐oscillatory.
- Representative traces demonstrating the effect of %ATP at 1.25 μM KaiA; the polarization data are shifted vertically to avoid overlaps and horizontally to align the first peaks.
- Fluorescence polarization measurements of oscillatory reactions at three %ATP conditions in the presence of 0.0, 2.5, and 4.5 μM KaiC S431A/T431A (AA). The period (left) and amplitude (right) of the reactions are extracted using the same curve fit method as for panel A; non‐oscillatory reactions are not shown.
- SDS–PAGE gel image of the supernatant from the KaiB‐FLAG immunoprecipitation experiment.
- Simulated KaiC AA titration experiment using the modified Phong model. The points are model predictions, and the solid line is a linear fit. The dotted line is the linear fit to the experimental results (see Fig 3G). The simulations are carried out at 100% ATP, 1.5 μM KaiA, and K D = 10−3 μM condition.
- Comparison of the metabolic compensation property of the Phong model without (left) or with (right) a phosphorylation threshold at K D = 10−3 μM. The model exhibits phase decoherence at low %ATP without a phosphorylation threshold.