
Figure 4. Ultrasensitivity contributes to metabolic compensation.
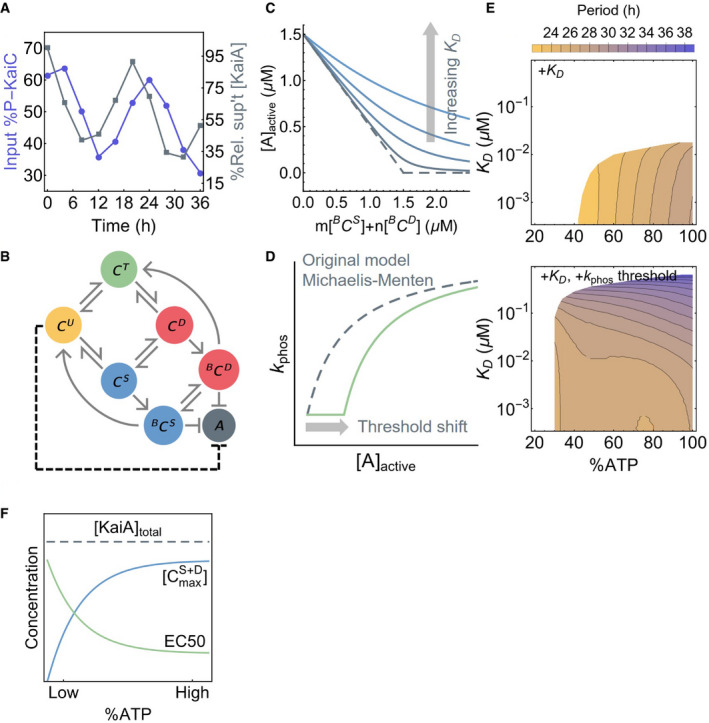
- The time series of the total input KaiC phosphorylation level (purple, left scale) and residual KaiA concentration not precipitated with KaiB‐FLAG (gray, right scale).
- A schematic of the oscillator model by Phong et al (2013). Here, BCS and BCD represent the KaiB‐bound S and D phosphoforms, respectively, which can sequester KaiA. The dashed line represents the effect of introducing ultrasensitivity to the model.
- A cartoon representation of introducing a KaiA sequestration affinity, K D, into the Phong model. The original model has an effectively infinite sequestration affinity (dashed curve).
- A cartoon representation of introducing a KaiA threshold to the Michaelis–Menten‐type phosphorylation rate constant in the Phong model.
- The period of the oscillator model as a function of %ATP and K D, a measure of KaiA sequestration affinity, without (top) or with (bottom) a phosphorylation threshold. All model simulations were done with 3.5 μM of KaiC and 1.5 μM of KaiA. White regions indicate unstable or no oscillation.
- The extent to which KaiA can be sequestered by KaiB depends on the maximal S and D phosphoform concentration, , achieved over the phosphorylation cycle. The scaling of the EC50 of the phosphorylation stimulus–response function, which is a measure of the capacity of the U phosphoform to suppress KaiA activity, compensates for the scaling of with %ATP.