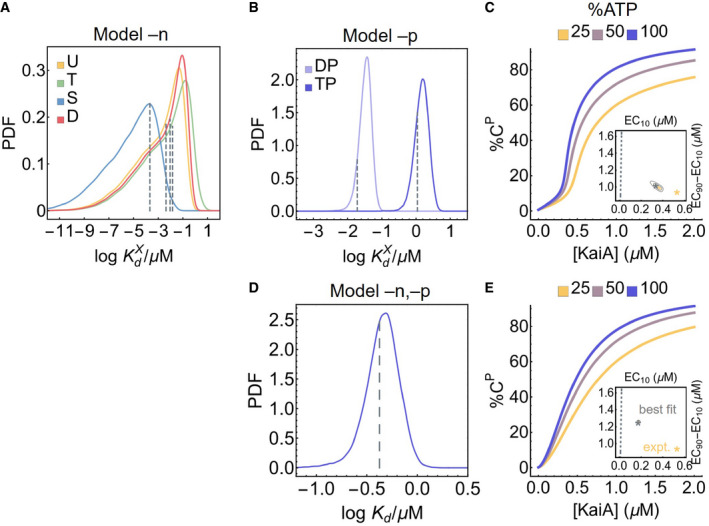
The posterior distributions for the KaiA dissociation constants as a function of KaiC phosphoform in model –n, where the KaiA on/off rates are decoupled from the nucleotide‐bound states of KaiC. The dashed lines represent the best fit.
Similar to (A), but for model –p, where the KaiA on/off rates are decoupled from the KaiC phosphoform; the dashed lines represent the best fit.
Cross sections of the stimulus–response relation at three %ATP, computed using model –p. The inset represents the posterior distribution for the shape measures of the stimulus–response function at 25% ATP. The contours represent the 68% and 95% HDRs, and the gray star represents the model best fit. The shape of the stimulus–response function is quantified using two metrics: EC10, which quantifies threshold‐like behavior, and EC90–EC10, which quantifies switch‐like behavior. The shape measures of the experimentally determined stimulus–response function at 25% ATP is shown as the yellow star. The dashed line represents (EC10, EC90–EC10) = (K/9, 80K/9), which characterizes the shape of a hyperbolic stimulus–response function [A]/(K + [A]) that has no switching or thresholding.
Similar to (A), but for model –n,–p, where there is a single KaiA on/off rate in the model.
Similar to (C), but for model –n,–p.