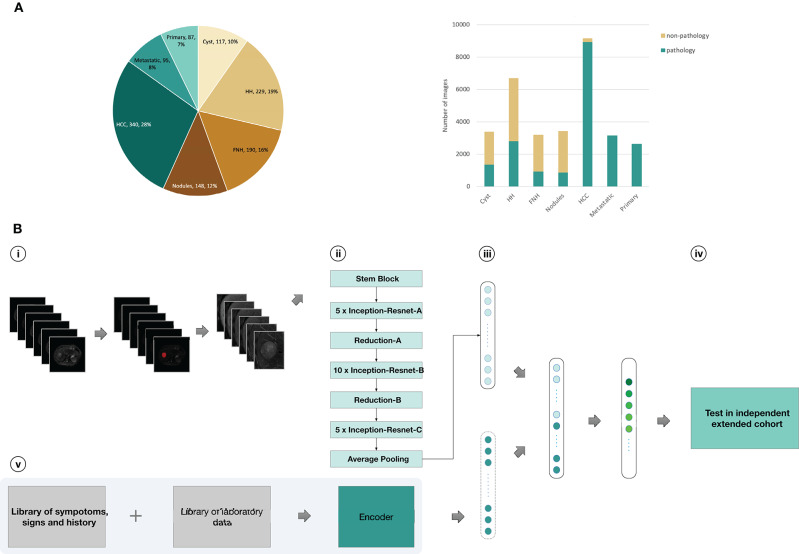
Figure 1.
Data and strategy. (A), Number of patients and images per category. (B), Strategy for development and validation. (B, i), Magnetic resonance images of patients in training set were first downloaded from the PACS; Liver tumors was outlined in related images of T2-weighted sequences as Regions of interest (ROI) by ITK-SNAP software; pre-processed images and obtained six different scan sequences pictures for each cross section of the lesion (T2, diffusion,T1 pre-contrast, late arterial phase, portal venous phase, equilibrium phase); (B, ii), six sequences of each cross section input to CNN as a whole-image from six channels, encoded clinical data was input to CNN; (B, iii), the Inception-ResNetV2 architecture was used and fully trained using the training set or partly retrained using the new-training set with clinical data; (B, iv), classifications were performed on images from an independent validation set, and the values were finally aggregated per patient to extract the T-SNE and the statistics; (B, v), Clinical data was encoded using one-hot encoding as preparation for three-way malignancy classifier. HH, Hepatic hemangioma; Nodules, other benign nodules; Metastatic, Metastatic malignancy from other sites; Primary, Primary malignancy except HCC.

