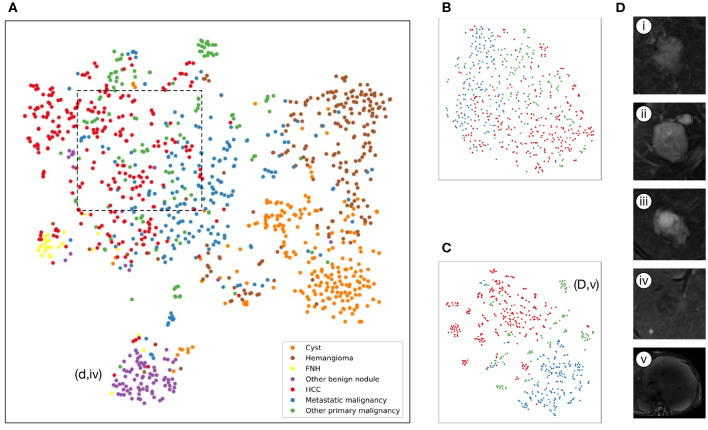
Figure 3.
Illustration of classifiers learned by deep-learning projected to 2 dimensions for visualization via the t-SNE algorithm using values of the last fully connected layer in the CNNs of the validation set. (A–C), Scatterplots where each point represents an image of lesions and the color represents the true category, show how the algorithm clusters. (A), Model A: seven-way classifier with six sequences images, shows that seven clusters of the same clinical classes, and we can see benign tumor clusters are better than that of three malignant tumors. The purple point clouds(benign nodules) are effectively divided from red point clouds (HCC). (B), Model E: three-way classifier with six sequences images for malignant tumors. (C), Model G: three-way classifier with three sequences images and clinical data for malignant tumors, shows that three different color point clouds are more effectively clustered than Model E. (D) Insets of T2 images show some categories. (i), Hepatocellular carcinoma (ii), Metastatic malignant tumors from pancreas (iii), Intrahepatic cholangiocarcinoma (iv) DN that are difficult to identify with HCC. (v) malignant fibrous histiocytoma represented by outlier point clouds of c(d,v).

