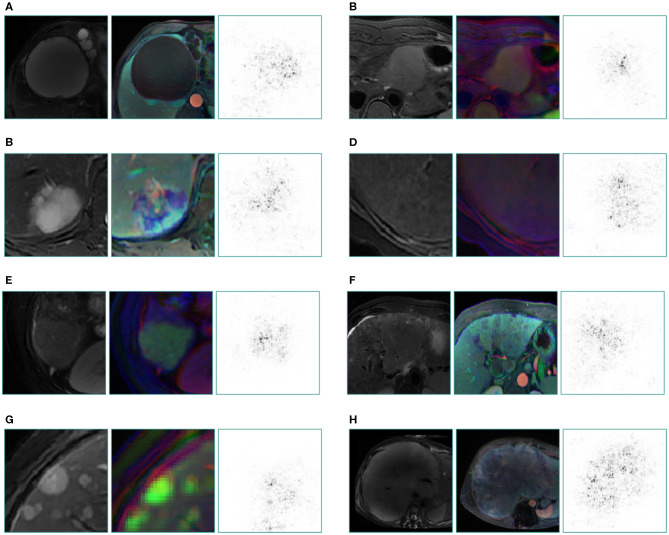
Figure 4.
Saliency map for example images from seven categories of the validation set and a special case which not appeared in training set. These maps reveal the pixels that most influence a CNN's prediction. Saliency maps show the pixel gradients with relative to the CNN loss function. Darker pixels represent pixels with greater influence. Clear correlation between lesions and saliency maps are revealed. We selected T2 image as the original control, the middle is reconstructed image of three sequences (the left column is from three plain scan sequences, the right column is from three enhanced sequences), the right is a corresponding saliency map. (A) cyst, (B) FNH, (C) hemangioma, (D) benign nodule, (E) HCC, (F) primary adenocarcinoma, (G) metastatic malignancy originating from pancreas, (H) malignant fibrous histiocytoma, which still gains a good display although this rare type did not appear in the training set.

