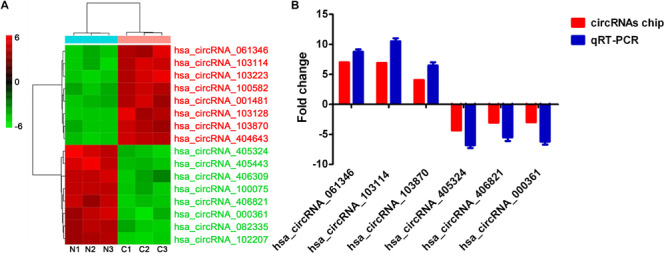
FIGURE 2.

qRT-PCR validation. (A) The cluster heat map of the top eight most up-regulated and down-regulated circRNAs. (B) Comparison of Arraystar human circRNAs chip data and qRT-PCR results. circRNAs expression levels were normalized to GAPDH. N, adjacent normal tissues; C, GIST tissues.
