
Figure 5. H3K4/27 methylation controls EGFR amplification.
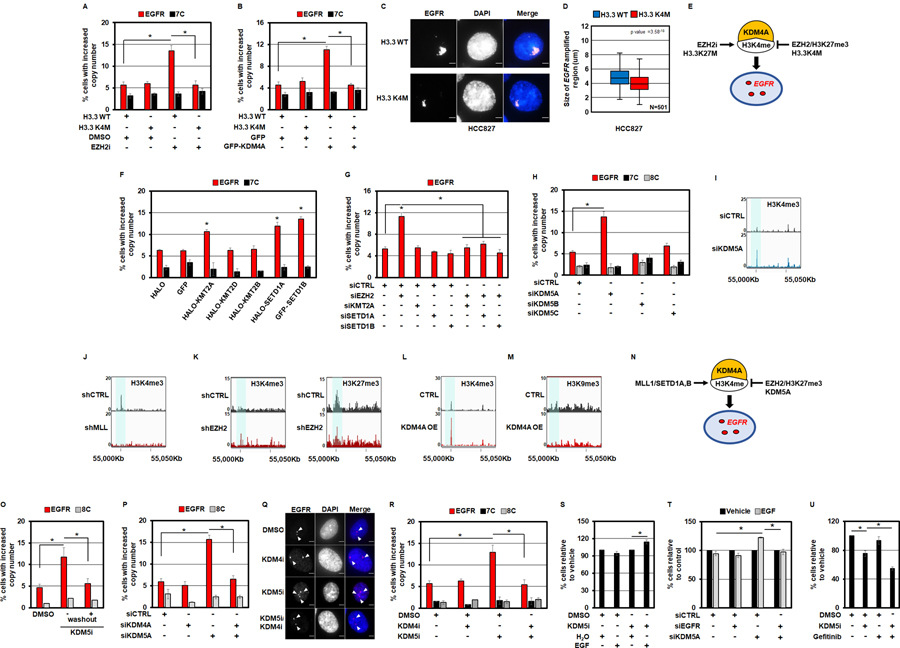
A) RPE cells transduced with H3.3 K4M completely inhibit EZH2i-mediated DNA copy gains of EGFR. B) RPE cells transduced with H3.3 K4M completely inhibit GFP-KDM4A overexpression-mediated DNA copy gains of EGFR. C) Representative DNA FISH images of HCC827 lung cancer cells transduced with H3.3 wild type (WT) or H3.3 K4M. EGFR (red) and DAPI (blue) are shown in merge. D) H3.3 K4M transduced HCC827 cells (red), reduces the size of EGFR amplified gene cluster clouds when compared to H3.3 WT transduced cells (blue). E) A model depicting the impact EZH2, H3K4M and H3K27M have on EGFR copy gains through KDM4A and H3K4 methylation based on the genetic experiments in panels A-D. F) Transient overexpression of HALO-tagged KMT2A and SETD1A as well as GFP-tagged SETD1B promote EGFR DNA copy gains in RPE cells. G) siRNA-mediated co-depletion of KMT2A, SETD1A or SETD1B with EZH2 completely blocks EZH2-depletion mediated EGFR copy gains in RPE cells. H) siRNA-mediated depletion of the H3K4 tri-demethylase KDM5A promoted EGFR copy number gains. I-M) A candidate control intergenic locus in the vicinity of the EGFR region. Input-normalized ChIP-seq tracks of H3K4me3 density near the EGFR locus (chr7:55Mbp) are highlighted in control cells (top tracks) versus cells treated with: siKDM5A (I), shMLL (J) (49), shEZH2 (K)(50), and KDM4A overexpression (L) in bottom tracks. H3K27me3 density is shown in the shEZH2 treated cells (bottom tracks) compared to control cells (top tracks) (50). H3K9me3 density is shown in the KDM4A overexpressing RPE cells (bottom tracks) compared to control RPE cells (top tracks). N) A model depicting the interplay between KMT2 enzymes (MLL1/SETD1A, B), KDM5A and EZH2 in regulating EGFR copy gains through KDM4A and H3K4 methylation based on the genetic and epigenomic experiments in panels F-M. O) EGFR copy number gains return to baseline 24hrs after KDM5i (1µM) removal (+washout). P) siRNA-mediated co-depletion of KDM4A with KDM5A, blocks KDM5A-depletion mediated EGFR copy gains. Q) Representative DNA FISH images of RPE nuclei from cells treated with KDM4i (1nM), KDM5i (1µM) or pre-treated with KDM4i (1nM) followed by KDM5i (1µM) treatment. EGFR (red), DAPI (blue) and merge are shown. R) A 24 hour pre-treatment of RPE cells with KDM4i (1nM) completely blocks KDM5i -mediated DNA copy gains of EGFR. S) RPE cells pre-treated with KDM5i (1µM) for 24 hours proliferate faster in response to a 24 hour stimulation with 50ng/ml EGF (compared to the respective vehicle control). T) KDM5A depleted RPE cells proliferate faster in response to a 24 hour stimulation with 50ng/ml EGF (compared to KDM5A-depleted cells treated with vehicle), which is rescued by co-depletion of EGFR. U) Co-treatment of RPE cells with KDM5i (1µM) and Gefitinib (2.5µM) reduces the percentage of cells relative to controls and single agent treatment as measured by trypan blue exclusion assay. Error bars represents S.E.M. The * represents p=≤0.05 by two-tailed Student’s t-test. The arrowheads mark DNA FISH foci. The scale bars are 5um.