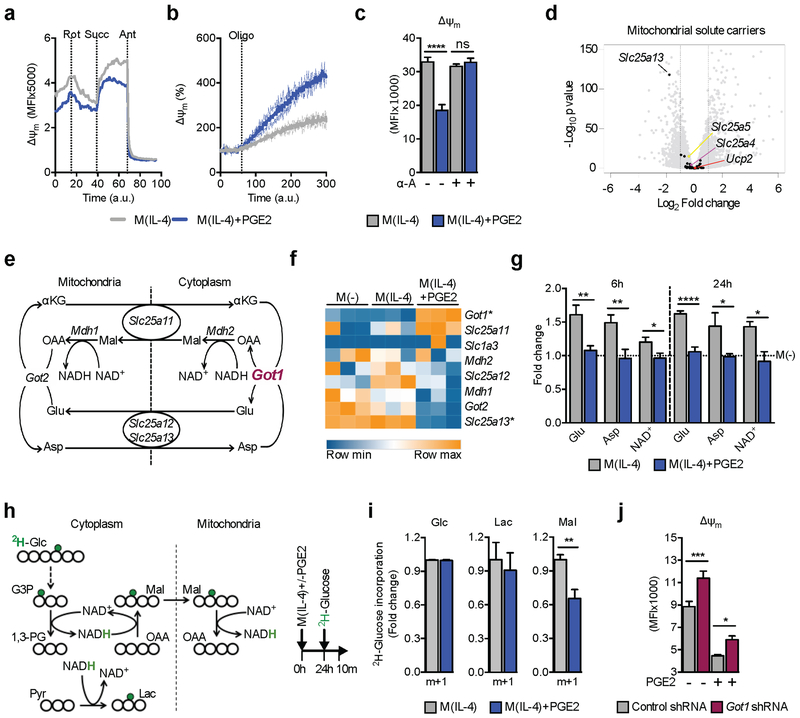
Figure 3. PGE2 regulates mitochondrial membrane potential through changes in the malate-aspartate shuttle (MAS).
(A-B) Real time contribution of ETC complexes to Δψm in BMMs stimulatd as indicated. Changes in Δψm after sequential treatment with rotenone (Rot), succinate (Succ) and antimycin (Ant) (A), or in response to oligomycin (B).
(C) Δψm in BMMs stimulated and treated with α-amanitin (α-A) as indicated for 24 h. Mean ± SEM from 6 biological replicates.
(D) Mitochondrial solute carrier gene expression in M(IL-4)+PGE2 stimulated for 6 h compared to M(IL-4).
(E) Schematic of the MAS.
(F) MAS gene expression in BMMs stimulated for 6 h as indicated. Statistically significant (adjusted p value < 0.1) up or down regulated (> 2 fold) genes from 3 biological replicates denoted by *.
(G) LC-MS quantitation of MAS metabolites in BMMs stimulated as indicated for 6 h or 24 h, normalized to M(−) (dotted line). Mean ± SEM from 3 biological replicates.
(H-I) Schematic (H) and results of using GC-MS to trace deuterium (green, H) in BMMs cultured in singly deuterated glucose (2H-Glc) into malate and lactate (I), plus depiction of stimulation strategy.
(J) Δψm in BMMs transduced with a control or Got1 targeting shRNA after 24 h stimulation with IL-4 +/− PGE2 as indicated. Means ± SEM from 6–7 biological replicates.
Data in A-C, G, I and J are representative of 3 independent experiments. (C, G, I-J) p*<0.05, p**<0.005, p***<0.0005, p****<0.0001. See also Figure S3.

