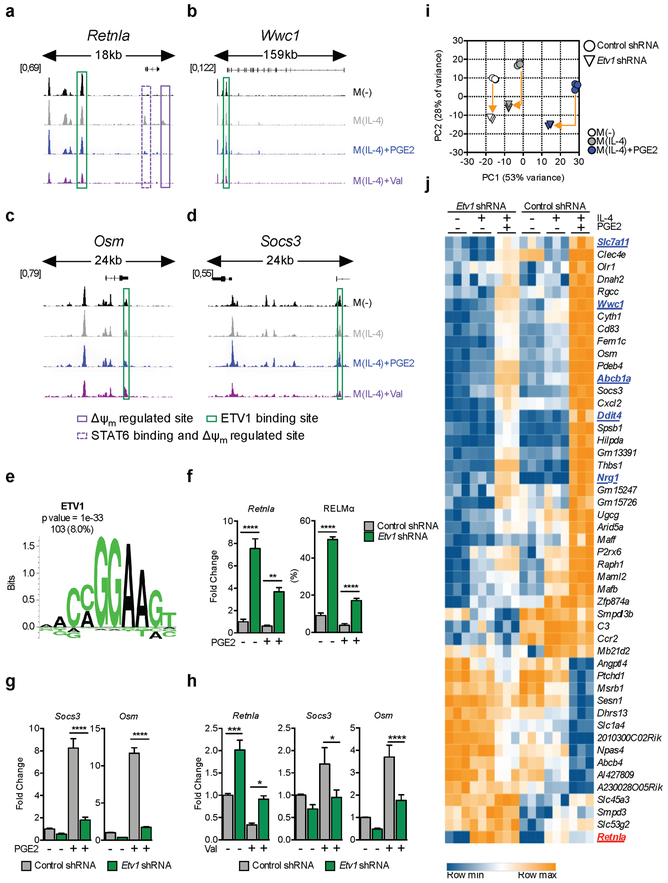
Figure 5. ETV1 is a mitochondrial membrane potential regulated transcription factor.
(A-D) Regions of accessible chromatin, measured by ATAC-seq, in VRGs Retnla (A), Wwc1 (B), Osm (C) and Socs3 (D), in BMMs treated as indicated for 6 h. Δψm-regulated peaks +/− STAT6 binding sites (solid and dotted purple lines respectively), or with predicted ETV1 binding sites (green), are highlighted.
(E) Enriched ETV1 motif in accessible chromatin regions up to 20kb upstream from transcription start sites of VRGs. Enrichment score (p value) and number plus percentage of matching regulatory regions (out of 1286 detected) are indicated.
(F-J) BMMs transduced with a control or Etv1 shRNA were stimulated with IL-4 +/− PGE2 or +/− Val (F-J). At 6 h RNA was extracted and tested by qRT-PCR for indicated genes (F-H), or by RNAseq (I-J). RELMα was assessed by flow cytometry after 24 h (F). RNAseq data from 3 biological replicates are presented as a principal component analysis (PCA), (I) and heat map (J) of 48 VRGs regulated (adjusted p value < 0.1, >2 fold change) in M(IL-4)+PGE2 by Etv1-shRNA. In (I), arrows provide a measure for the magnitude of variation for each treatment, and in (J), genes associated with cell cycle are in blue and Retnla is in red.
(F-H) Mean ± SEM from 3–8 biological replicates, p*<0.05, p**<0.005, p***<0.0005, p****<0.0001. See also Figure S5.

