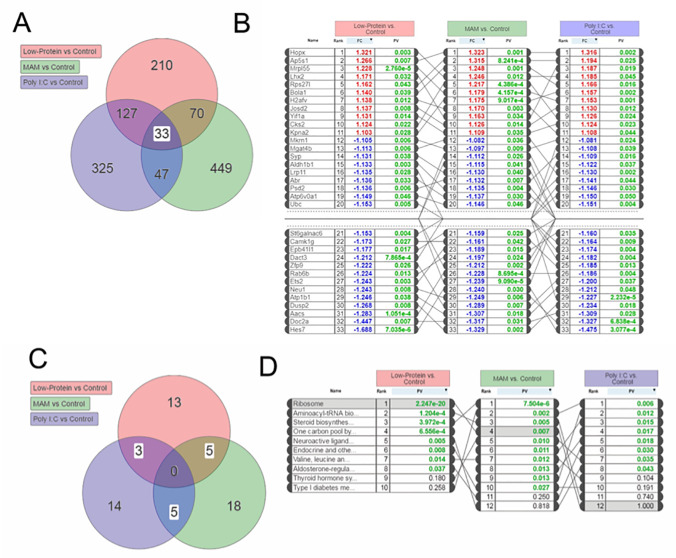
Fig 2. Transcriptional analysis identified consistent and overlapping changes in gene expression across three developmental models of schizophrenia.
(A) Venn Diagram showing the number of genes that were differentially expressed in each schizophrenia model compared to control animals. Of these, 33 genes were differentially expressed in all three models. (B) The differentially expressed genes that were affected by all three prenatal manipulations, were ranked. (C) Venn Diagram depicting the pathways differentially altered by all three conditions. (D) Those pathways that showed overlap between at least 2 treatment groups are ranked.

