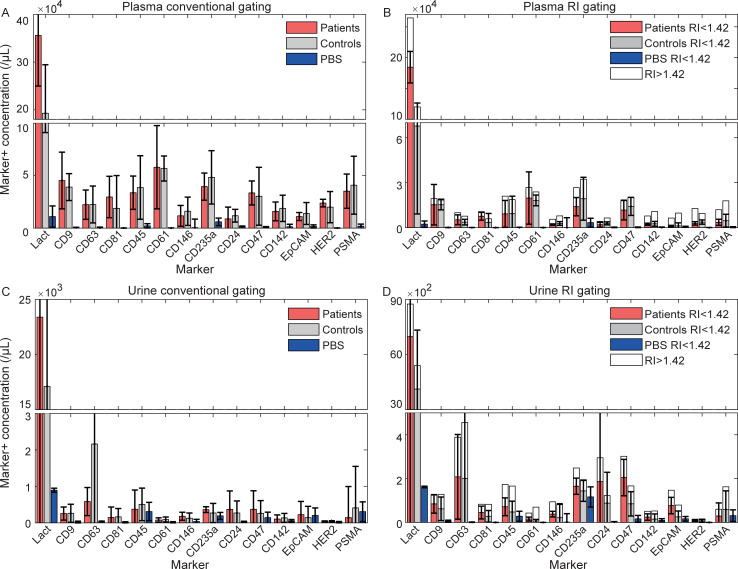
Fig 2.
Marker+ concentration by flow cytometry per μL plasma (A-B) or urine (C-D) from metastatic castration-resistant prostate cancer patients (red, n = 5), healthy controls (grey, n = 5) and phosphate buffered saline (blue, n = 2). Panels B and D show the refractive index (RI) of marker+ particles >200 nm. Data shown represent the median and standard deviation (whiskers) per group. Lact: lactadherin.

