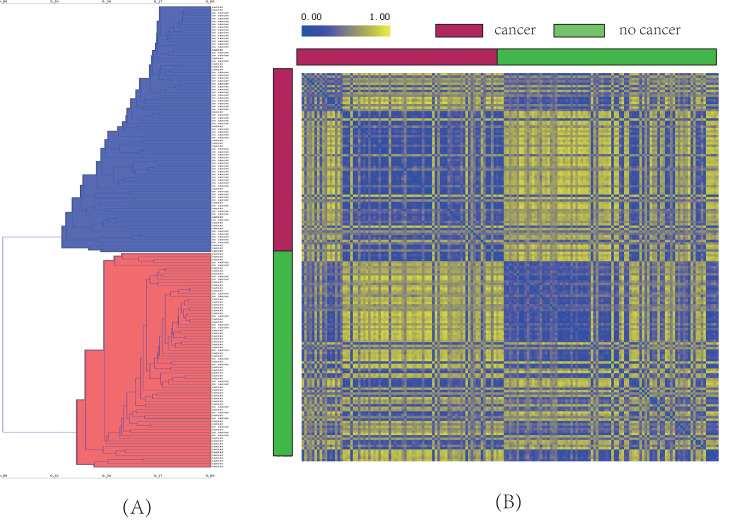
Fig 2. Clustering results of 163 smokers.
(A) Unsupervised hierarchical clustering results, blue represents predomination of non-lung cancer, red represents domination of lung cancer; (B) Distance map of lung cancer samples and non-lung cancer samples. The closer the distance, the closer the color is to blue; the further the distance, the closer the color is to yellow.

