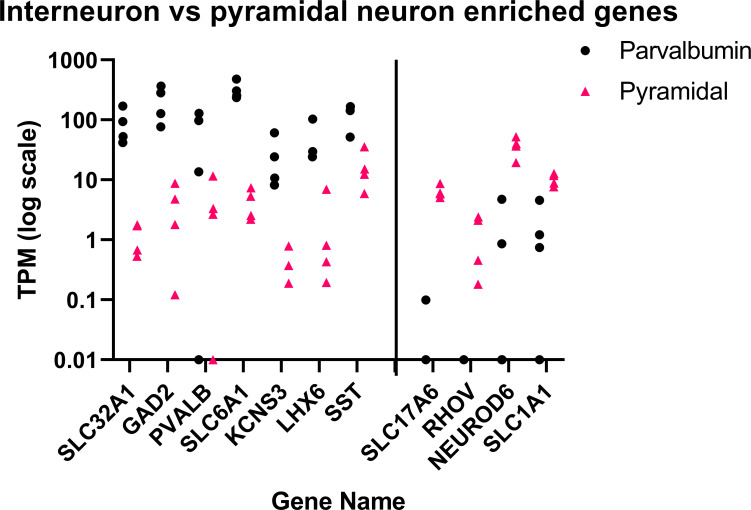
Fig 1. Interneuron versus pyramidal neuron enriched genes.
Expression of cell-type specific or enriched genes in parvalbumin interneurons (black circles) versus pyramidal neurons (red triangles). Each point represents 200 laser-captured cells pooled from a single brain section. The y-axis represents TPM expression of each gene on a log scale. A vertical line separates interneuron markers (left) from pyramidal neuron markers (right).

