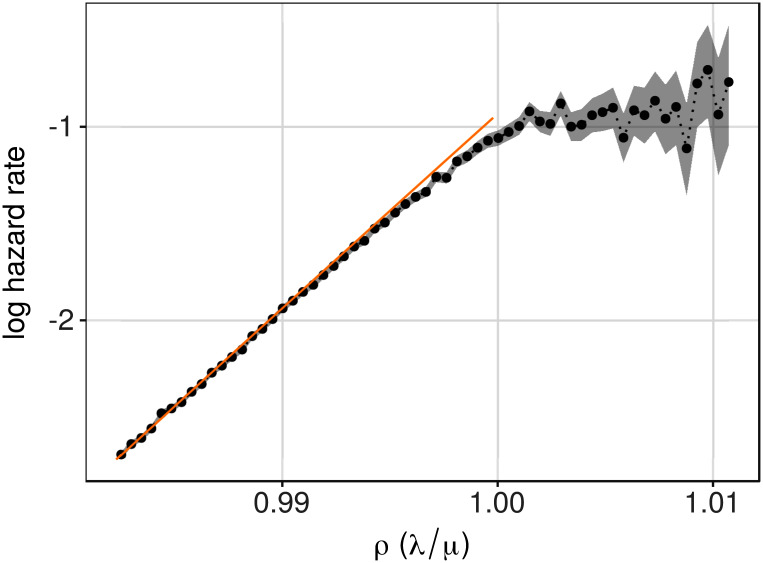
Fig 4. Hazard rates as a function of ρ, i.e., (λ/μ), close to 1.
The dashed region represents 95% confidence intervals (from a Poisson approximation), and the orange line represents predictions from the theory (Eq 6). Model parameters were: λ = 540, μ0 = 550, β = 0.52/365, θ = 100, and 4.0 × 10⁵ realizations of the systems were run.

