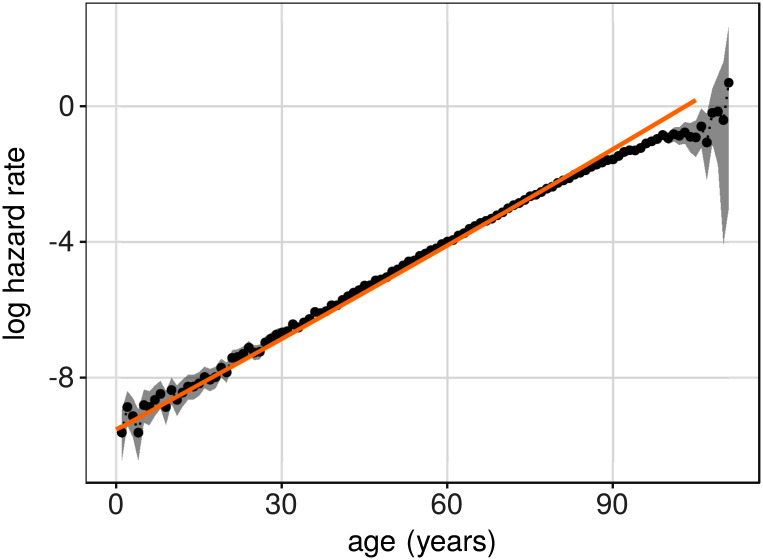
Fig 5. Estimated hazard rates (points) for a model system with heterogeneity in μ0.
The gray region represents 95% confidence intervals (from a Poisson approximation), and the orange line represents hazard rates for a model system without heterogeneity. Heterogeneity was modeled by sampling values of μ0 from a normal distribution with mean 550 and variance 4. Other model parameters were: λ = 500, β = 0.485/365, θ = 100. Results are based on 1.2 × 10⁵ model realizations.

