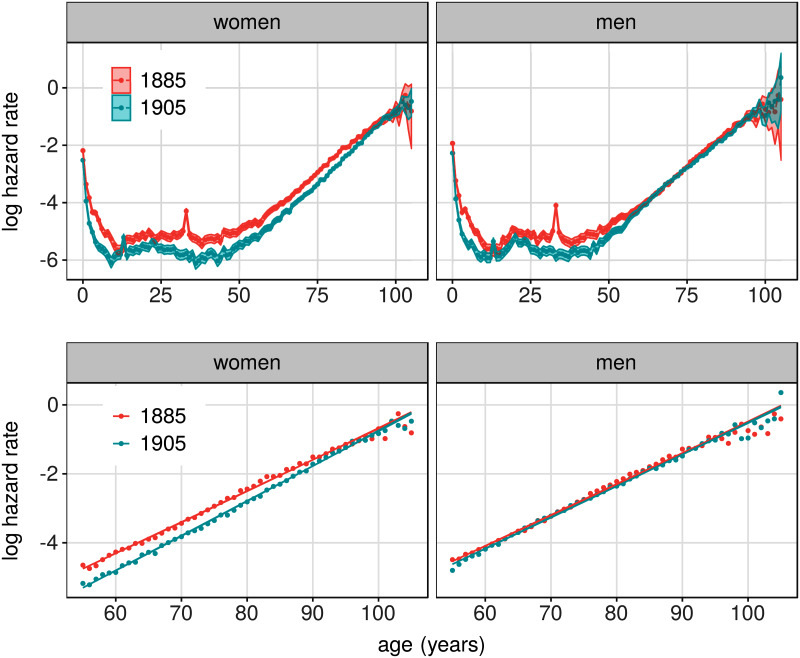
Fig 6. Hazard rates estimated from mortality data from Sweden.
Top panels show estimated mortality rates for men and women born 1885 and 1905. Shaded areas show extent of 95% confidence intervals of these estimates. Lower panels show the same data, but restricted to ages ≥ 55. Solid lines in lower panels show hazard rates from the model fits.

