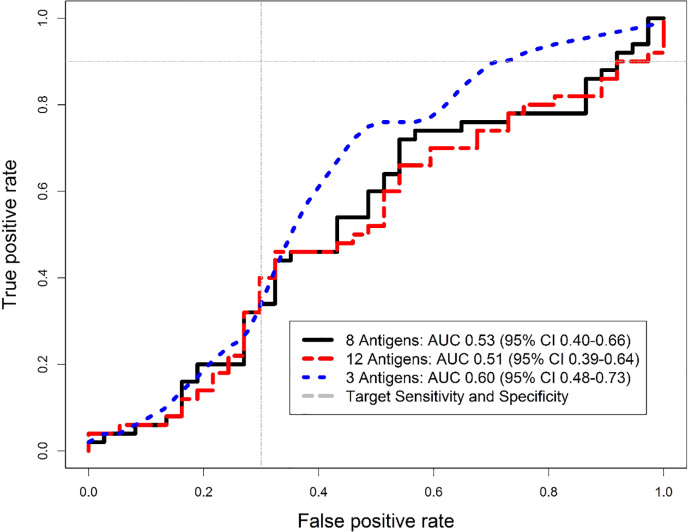
Fig 4. Comparison of antigen panel Receiver Operating Characteristic (ROC) curves.
We overlaid the ROC curves of the three multi-antigen serological panels to compare performance and the area under the curve (AUC). The black line is the 8-antigen panel, red is the 12-antigen panel, and blue is the best performing 3-antigen panel (Rv0934-P38, Ag85A, and Rv2031-HSPX). The grey lines indicate the minimum target performance for a TB triage test with True Positive Rate of 0.9 and False Positive Rate (1- Specificity) of 0.3.

