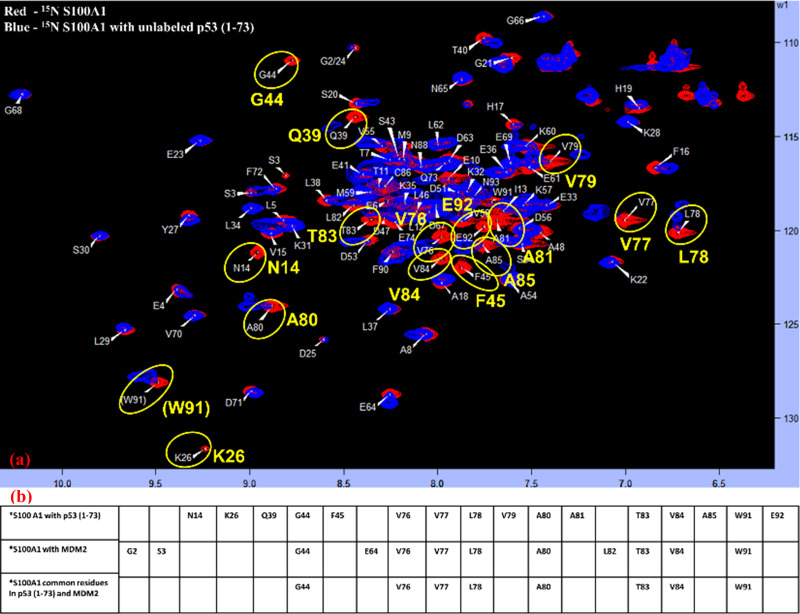
Fig 7. Exploration of the connected interface (S100A1/p53 (1–73)) section in S100A1.
(a) The 1H-15N HSQC spectra overlay of free 15N S100A1 (red) and in complex with unlabelled p53 (1–73) (blue). Cross-peaks displaying variation in their magnitude are highlighted in yellow. (b) Table illustrating a list of the affected residues when 15N S100A1 interacts with the unlabeled p53 (1–73) and unlabeled MDM2 and also showing the common interacting residues.

