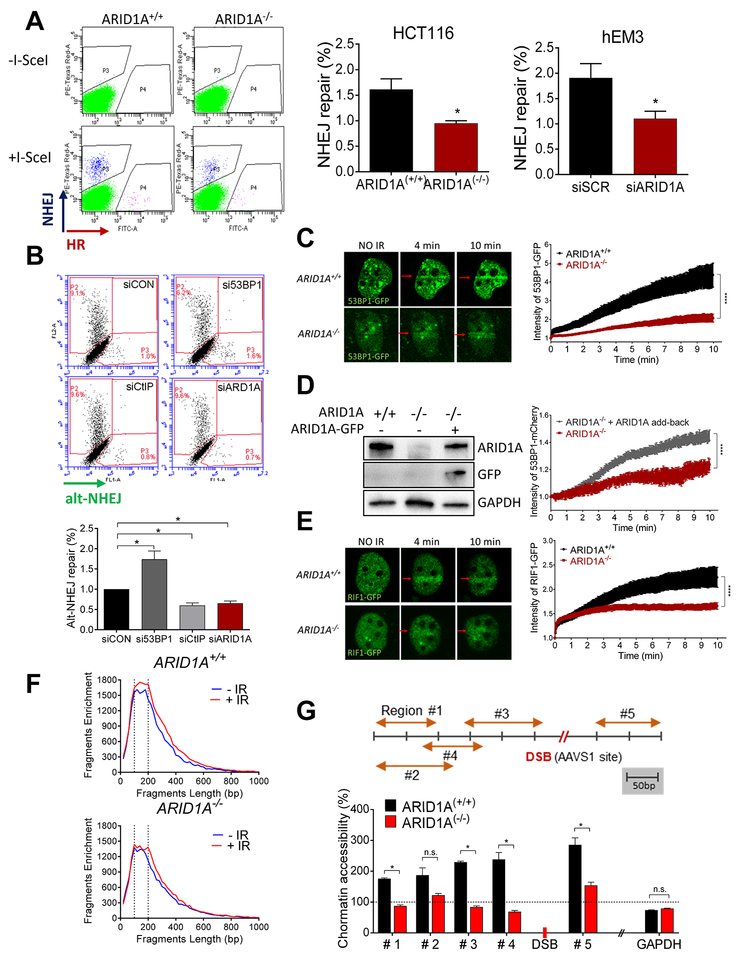
Fig. 2. ARID1A deficiency suppresses NHEJ-mediated repair of DSBs and chromatin accessibility.
(A) (left) Flow cytometric analysis of TLR expressing HCT116 ARID1A+/+ and ARID1A−/− cells performed 72 h after transduction with the I-Sec/GFP donor lentiviral construct. DSB repair mediated by HR is seen as GFP+, and repair mediated by NHEJ is seen as mCherry+. (right) Histograms show quantification of NHEJ repair in both isogenic HCT116 and gEM3 cells. Data are presented as mean ± SEM, n=4. Mann-Whitney test (two-tailed) was used to calculate statistical significance; *p<0.05. (B) Flow cytometric analysis of EJ2-expressing U2OS cells after transfection with specific siRNAs. Four days after transfection with I-Sec, alt-NHEJ repair ability, seen as a GFP+ signal, was quantified and plotted. Data are presented as mean ± SEM, n=4; *p<0.05. (C) (left): Representative live-cell images of ARID1A+/+ and ARID1A−/− cells expressing 53BP1-GFP at the indicated time points after microirradiation (red arrow). (right): Intensity of GFP at irradiated area (yellow box) was measured every 3 seconds and plotted after normalization. Data are presented as mean ± SEM; more than 7 cells were analyzed per group. (D) Immunoblots showing expression of ARID1A, GFP, and GAPDH. ARID1A−/− cells were co-transfected with 53BP1-mCherry and/or ARID1A-GFP. The intensity of mCherry at the micro-irradiated sites from the indicated cells was monitored over time. Data are presented as means ± SEM; more than 6 cells were analyzed per group. (E) (left): Representative live images of cells transfected with RIF1-GFP at the indicated time points after microirradiation (red arrow). (right): Intensity of GFP at irradiated area (yellow box) was measured every 3 seconds and plotted after normalization. Data were plotted as described in (C); more than 12 cells were analyzed per group. (C-E) Two-way ANOVA with Bonferroni correction was used to calculate the statistical significance; ***p<0.001. (F) ATAC-seq analysis was performed in ARID1A+/+ and ARID1A−/− cells before (blue) and 1 h after (red) irradiation (4 Gy). Fragment size (~146 bp) shown with dotted lines. (G) Schematic representation of the genomic locus of AAVS1 (chromosome 19) and regions amplified with specific primers (orange arrows). Following localized DSB at the AAVS1 site (red) (CRISPR/Cas9 transfected cells), chromatin was isolated from ARID1A+/+ and ARID1A−/− cells and was subjected to nuclease digestion or was untreated. Chromatin accessibility at specified regions was calculated and plotted after normalization to no-DSB control (CRISPR/Cas9 control plasmid transfection). GAPDH, which is located on a different chromosome (chromosome 12), was used as a control. Data are presented as mean ± SEM, n=4; *p<0.05.

