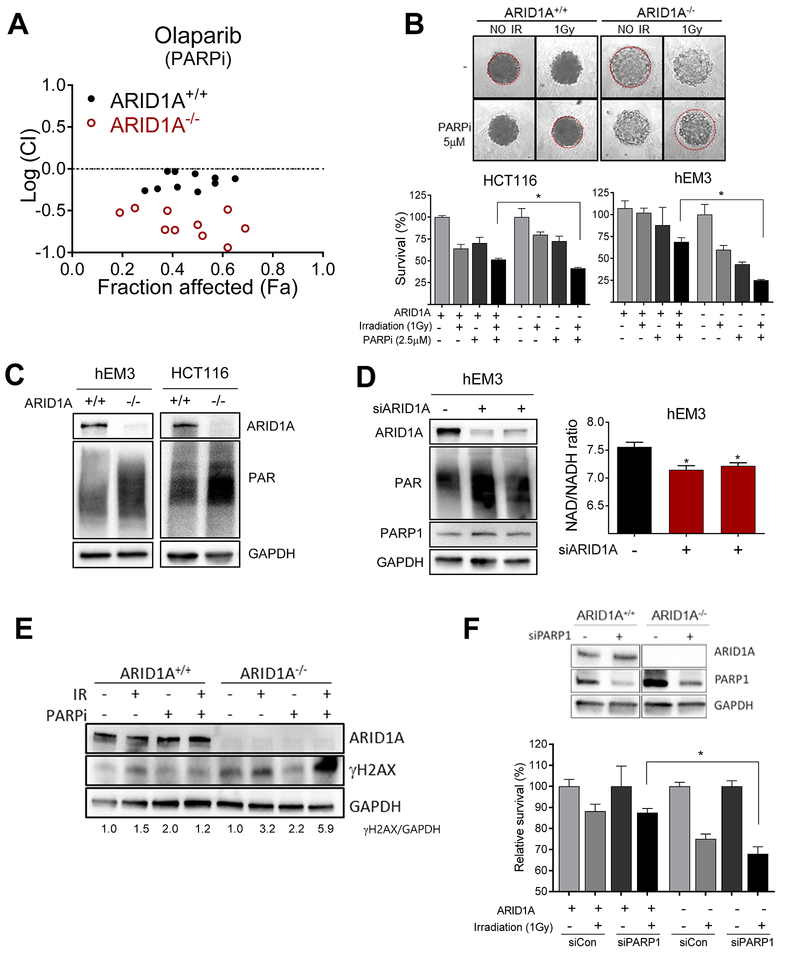
Fig. 3. Synergy between PARP inhibition and radiation in ARID1A-deficient cells.
(A) Logarithmic combination index (CI) plot of irradiation (1–2 Gy) in combination with PARP inhibitor, olaparib, over a range of concentrations in ARID1A+/+ and ARID1A−/− cells. The horizontal dashed line at Log (CI) = 0 separates synergy [Log (CI)<0] and antagonism [Log(CI)>0]. (B) Representative images of 3-D culture spheroids are shown. After treatment as indicated, cell survival was measured and plotted. Data are presented as mean ± SEM, n=4. Mann-Whitney test (two-tailed) was used to calculate the statistical significance between two comparison groups; *p<0.05. (C) Immunoblots for ARID1A, PARylation, and GAPDH of extracts from indicated cell lines. (D) (left) Immunoblots for ARID1A, PARylation, PARP1 and GAPDH of extracts from hEM3 cells transfected with ARID1A siRNA or scramble control siRNAs. (right) NAD/NADH ratio determined in hEM3 cells transfected with ARID1A or control siRNAs. Data are presented as mean ± SEM, n=4; *p<0.05. (E) Immunoblots for ARID1A, γH2AX, and GAPDH. The ratio of γH2AX/GAPDH is indicated at the bottom. (F) (top) Immunoblots showing efficiency of PARP1 silencing by siRNAs. (bottom) Effect of PARP1 knockdown on survival of ARID1A+/+ and ARID1A−/− tumor cells in the presence or absence of irradiation. Data are presented as mean ± SEM, n=4; *p<0.05. Mann-Whitney test (two-tailed).

