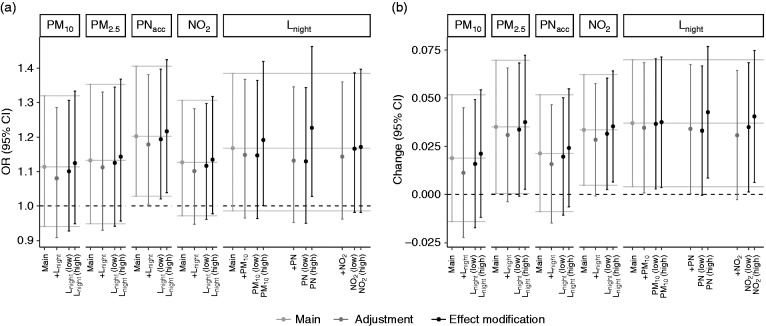
Figure 2.
Effect estimates (95% confidence intervals) per interquartile range (IQR) exposure increase on thoracic aortic calcification (TAC) progression in participants with TACt0 < 10: co-exposure adjustment (dark grey) and effect modification (black). (a) TAC progression; (b) change of TAC growth rate. Models are adjusted for age, sex, smoking, alcohol consumption, physical activity, education and follow-up time. Complementing numbers are presented in Supplementary Table 7.

