
Figure 5 – Region-Specific Metabolic Impact of mTOR Inhibition.
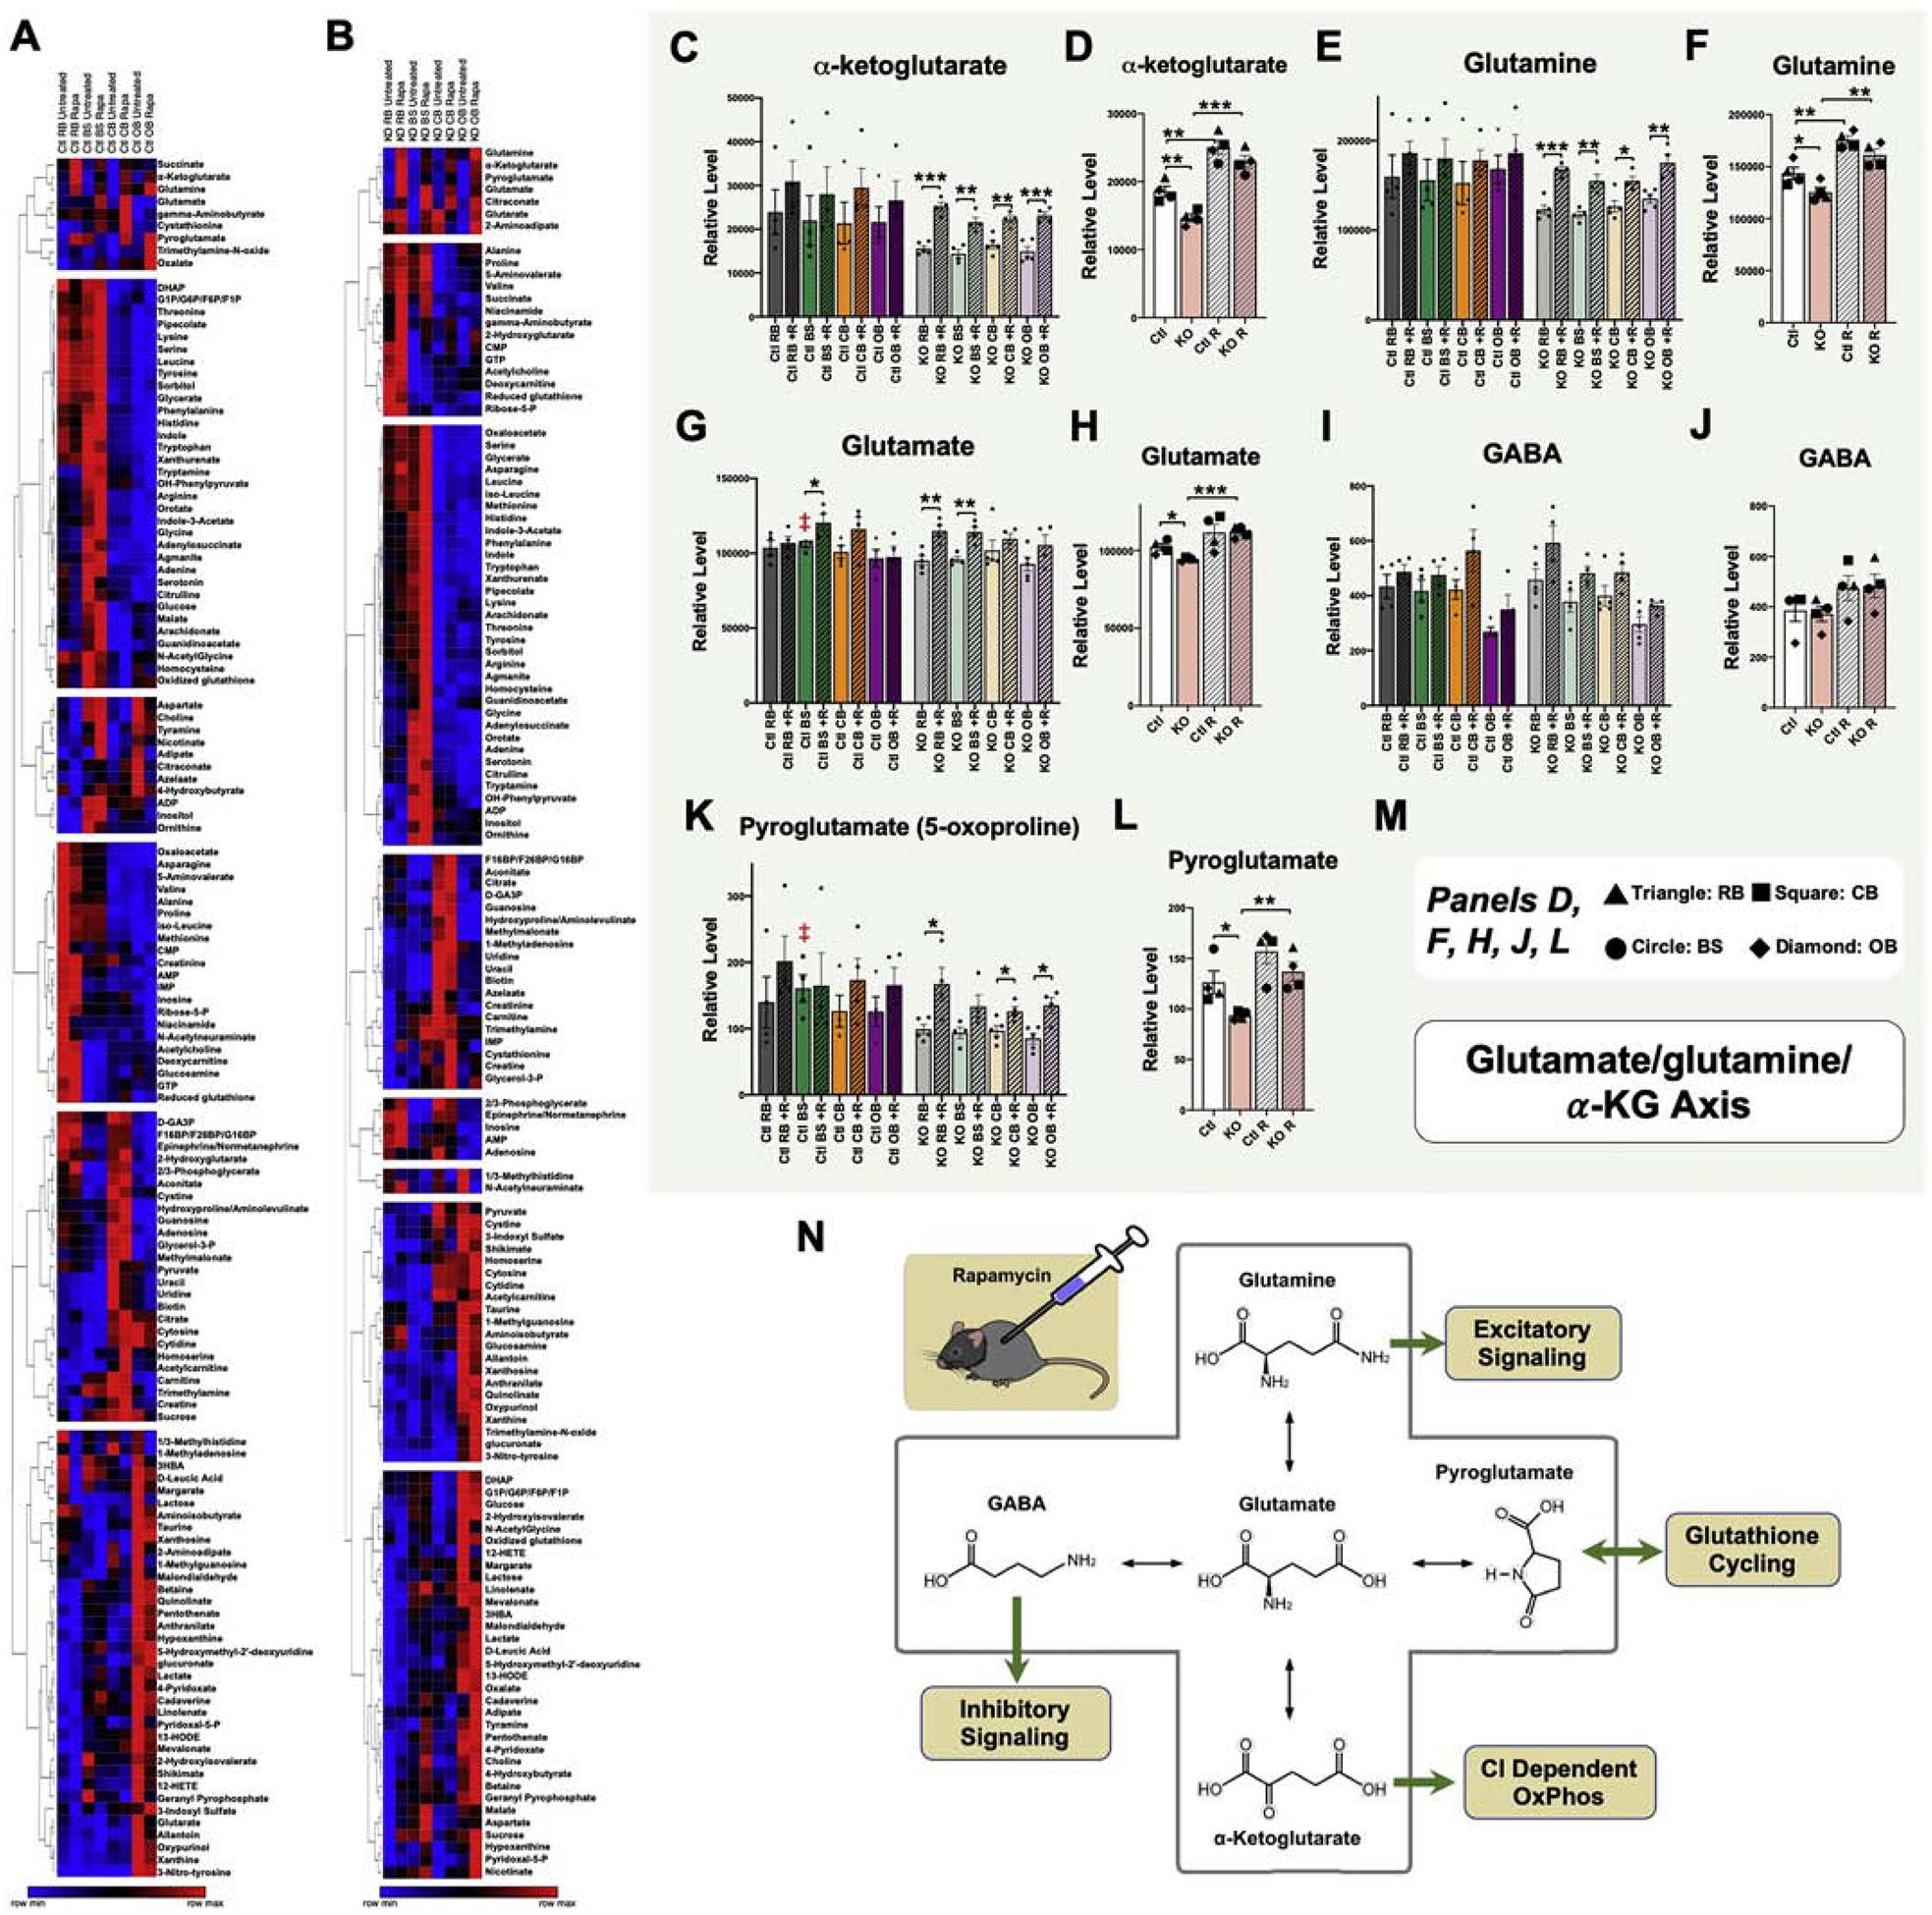
(A-B) Unsupervised clustering of brain region metabolite levels in untreated and rapamycin treated control (A) and Ndufs4(KO) (B) mice. Metabolites appearing in cluster 1 in both control and Ndufs4(KO) datasets indicate a rapamycin-responsive glutamate/glutamine/α-ketoglutarate metabolite group. (C) α-ketoglutarate levels by brain region, genotype, and treatment. ANOVA *p=0.01. (D) Data-reduced α-ketoglutarate data using median values for each brain region, revealing genotype and treatment dependent, region independent, changes. ANOVA ***p<0.0001. (E) Glutamine levels by brain region, genotype, and treatment. ANOVA **p=0.005. (F) Data-reduced glutamine data using median values for each brain region, revealing genotype and treatment dependent, region independent, changes. ANOVA ***p<0.0001. (G) Glutamate levels by brain region, genotype, and treatment. ANOVA **p<0.005. (H) Data-reduced glutamate data using median values for each brain region, revealing genotype and treatment dependent, region independent, changes. ANOVA **p=0.0055. (I) GABA levels by brain region, genotype, and treatment. ANOVA ***p<0.0001. (J) Data-reduced GABA data using median values for each brain region, revealing genotype and treatment dependent, region independent, changes. Not significantly different by ANOVA. (K) Pyroglutamate levels by brain region, genotype, and treatment. ANOVA *p=0.03. (L) Data-reduced pyroglutamate data using median values for each brain region, revealing genotype and treatment dependent, region independent, changes. ANOVA **p=0.004. (M) Symbol key for panels D, F, H, J, and L; triangles, squares, circles, and diamonds represent the median values (across biological replicates) for ‘resistant brain’ (RB), cerebellum (CB), brainstem (BS), and olfactory bulb (OB), respectively. (C, E, G, I, K) Dots represent biological replicates (N>=4); columns and error bars designate median values and standard error of the mean. (D, F, H, J, L) Dots represent median values (among biological replicates) for each brain region. Columns represent median values among regions within the same genotype and treatment, and error bars represent standard error of the mean. (C-L) pairwise t-test p-values * designates p≤0.05, ** designates p≤0.005, and *** designates p≤0.0005. (N) Schematic of the glutamine/glutamate/α-ketoglutarate metabolite group with key CNS functions of each glutamate metabolite indicated. Ctl RB= control resistant brain region, KO RB= knockout resistant brain region, Ctl CB = control cerebellum, KO CB = knockout cerebellum, Ctl BS = control brainstem, KO BS= knockout brainstem, Ctl OB= control olfactory bulb, KO OB= knockout olfactory bulb. For (D,F,H,J,L) Ctl and KO represent untreated wild type and Ndufs4(KO) averages, respectively; Ctl R and KO R represent rapamycin treated wild type and Ndufs4(KO) averages, respectively.