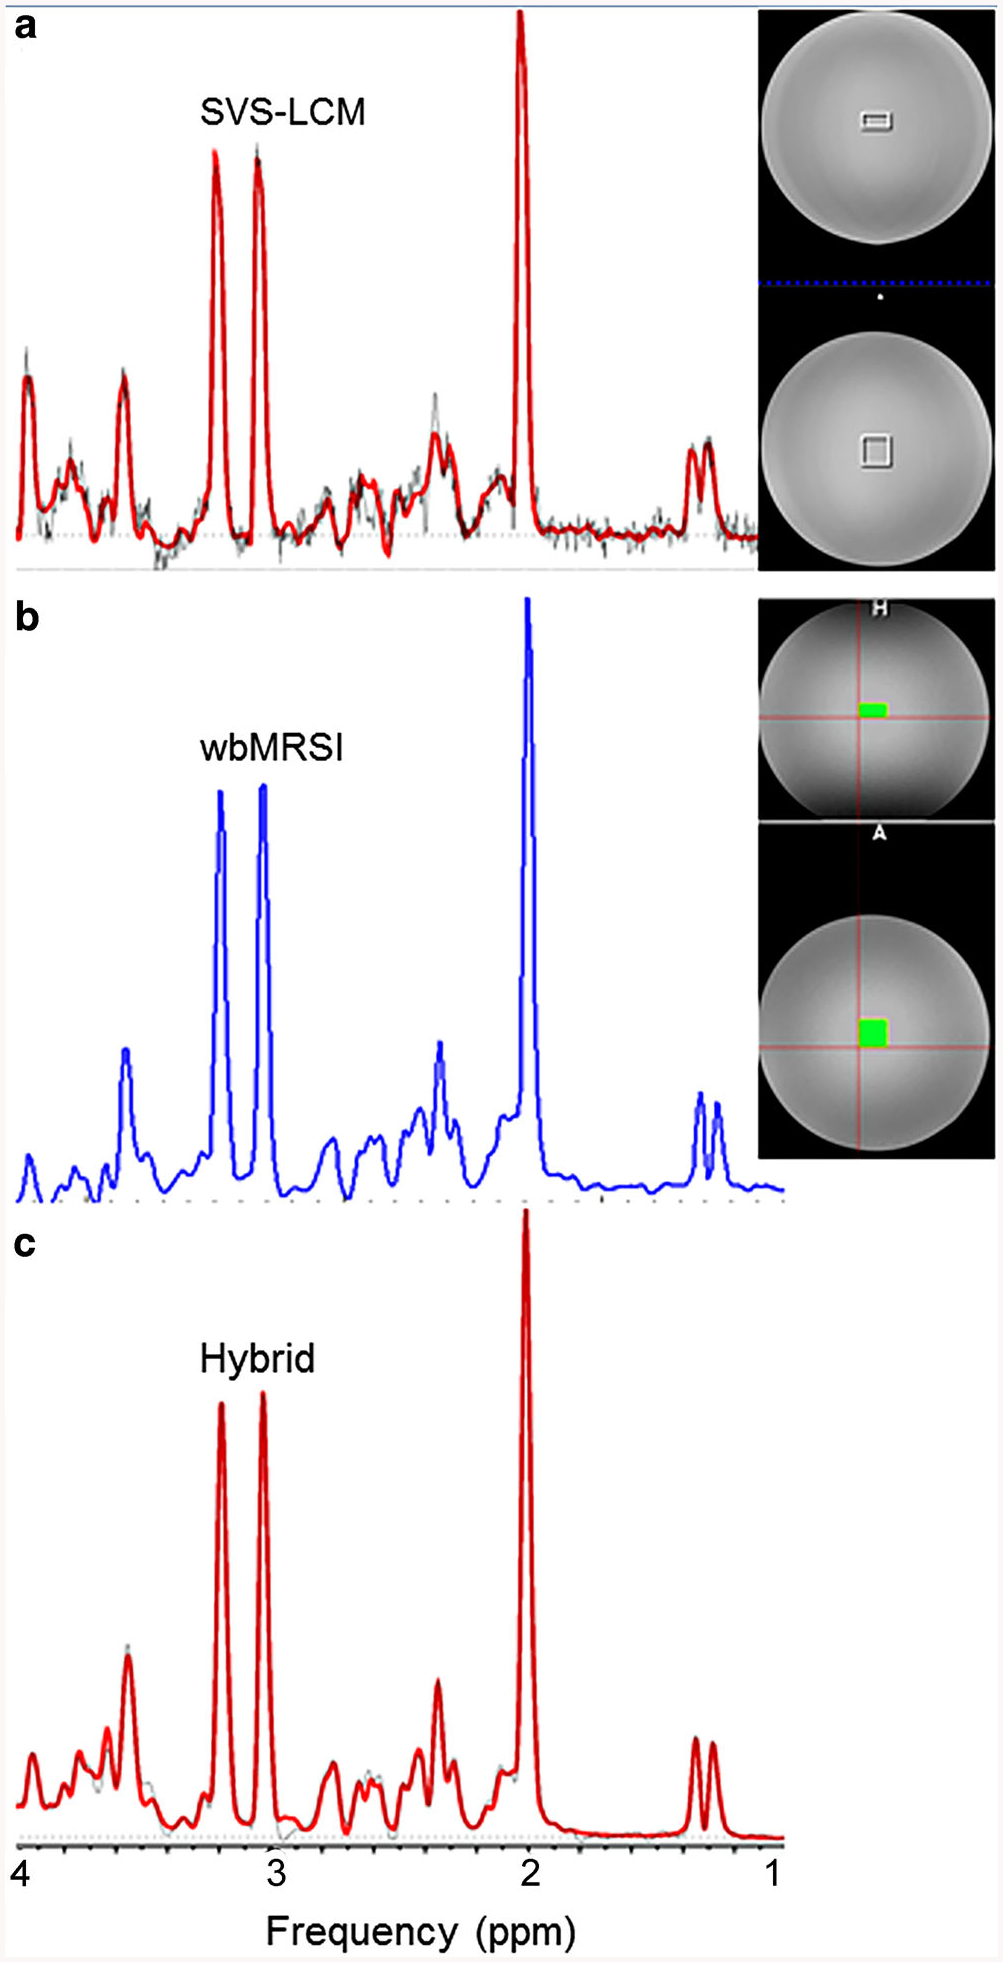
Fig. 1.

MR spectra and the regions of interest (ROIs) used, shown on the T1-weighted image of the aqueous phantom. a The spectrum of a single voxel spectroscopy (SVS) acquisition and the LCModel fit curve of the ROI are shown as empty squares (SVS-LCM method). b The integrated spectrum from the whole brain MR spectroscopic imaging (wbMRSI) data from the same ROI volume used for the SVS voxel (wbMRSI). c The integrated spectrum and the LCModel fit (hybrid)
