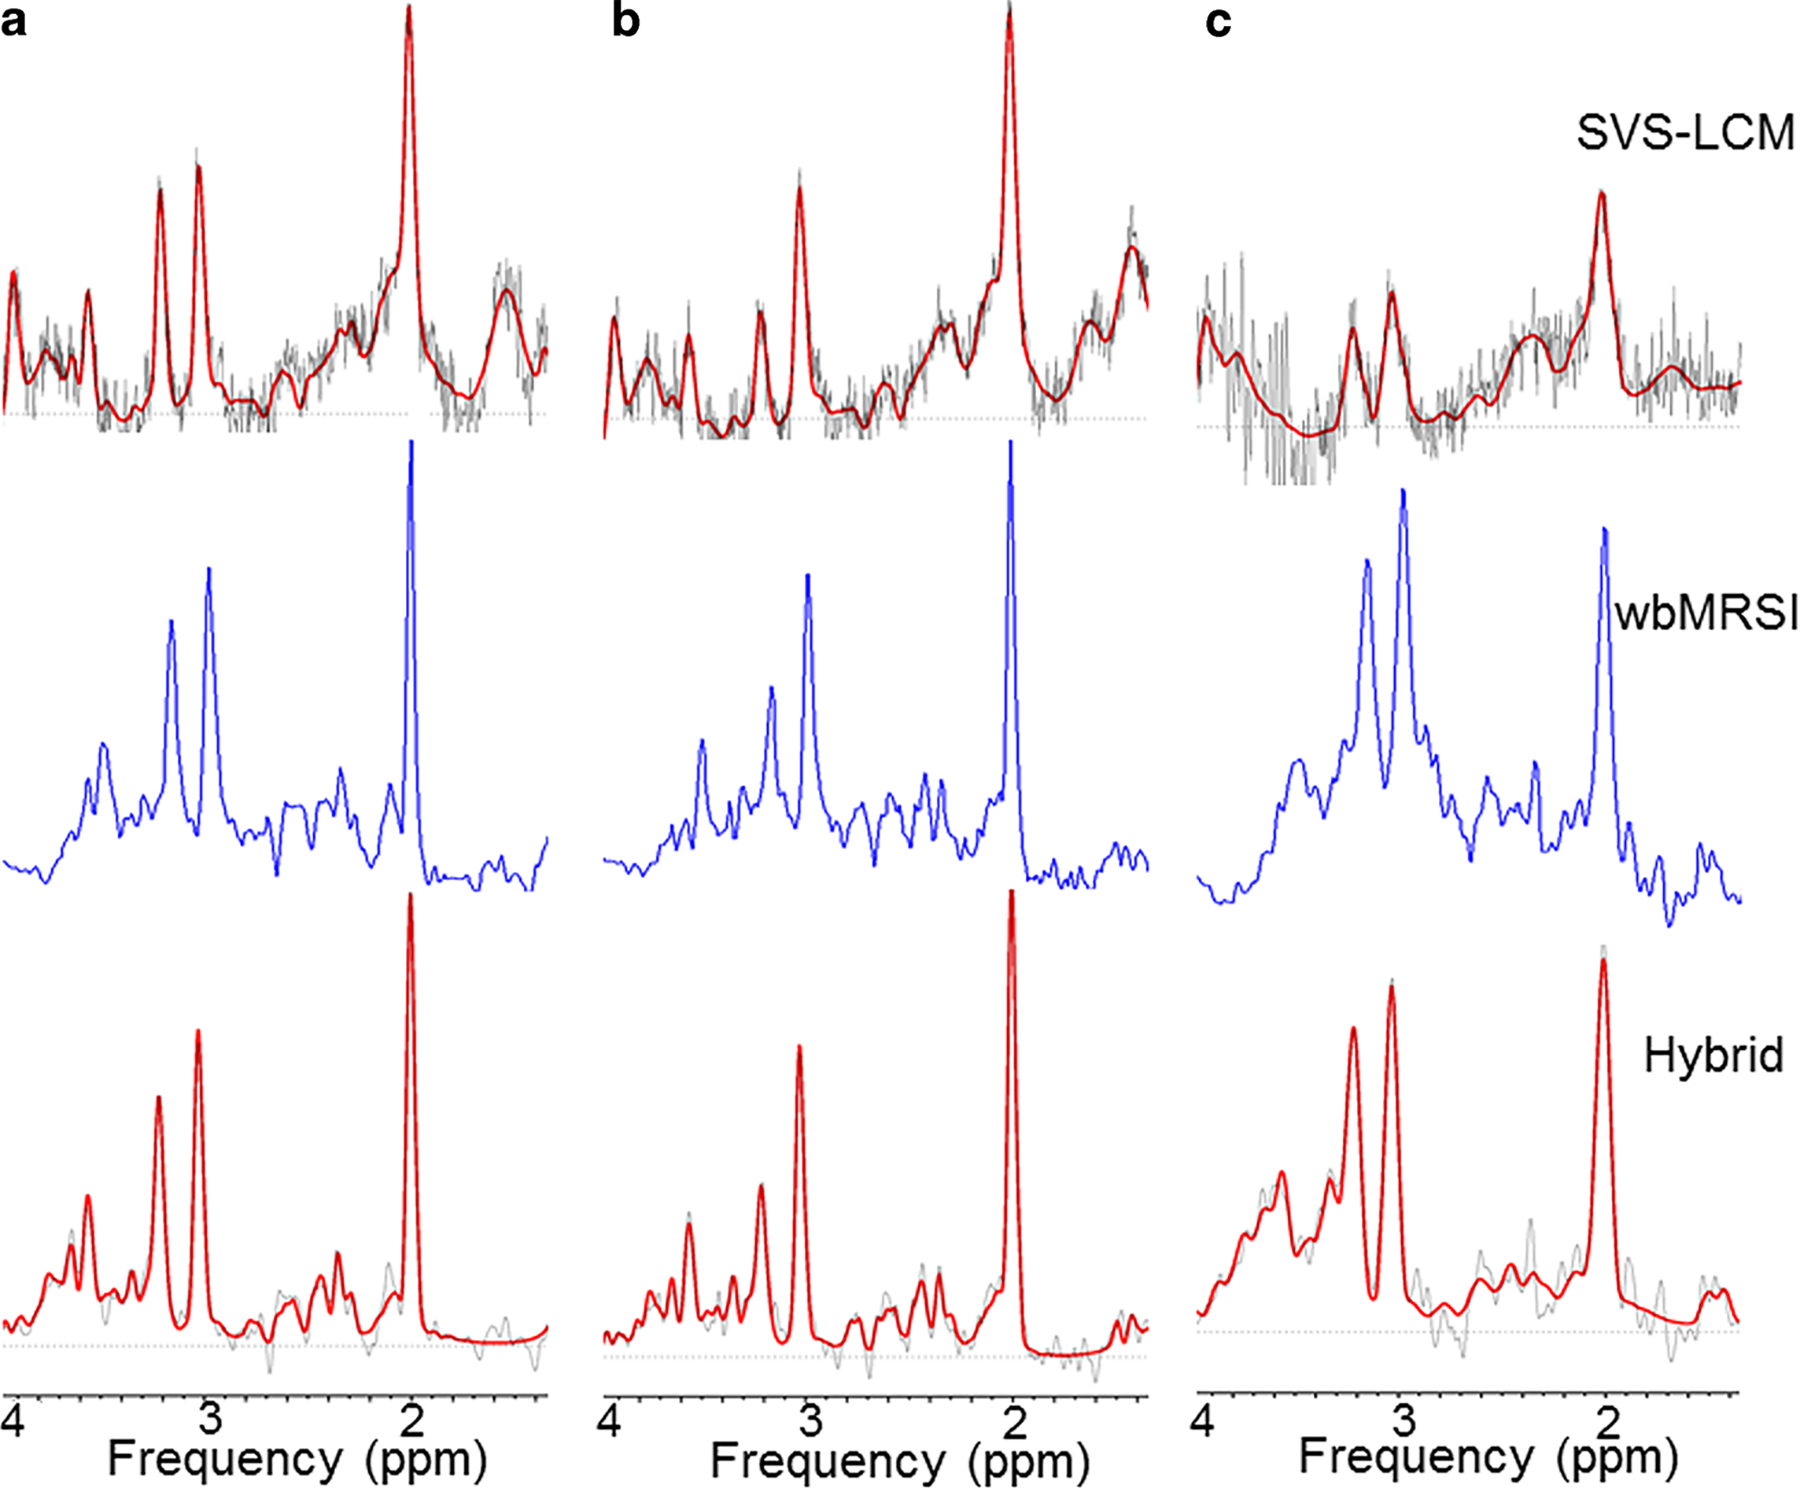
Fig. 3.

Spectra and fit results for SVS scans with the LCModel fit (first row), wbMRSI measurements (second row) and wbMRSI measurements with LCModel fit (third row). Data are shown for parietal white matter (column a), occipital grey matter (column b) and basal ganglia (column c)
