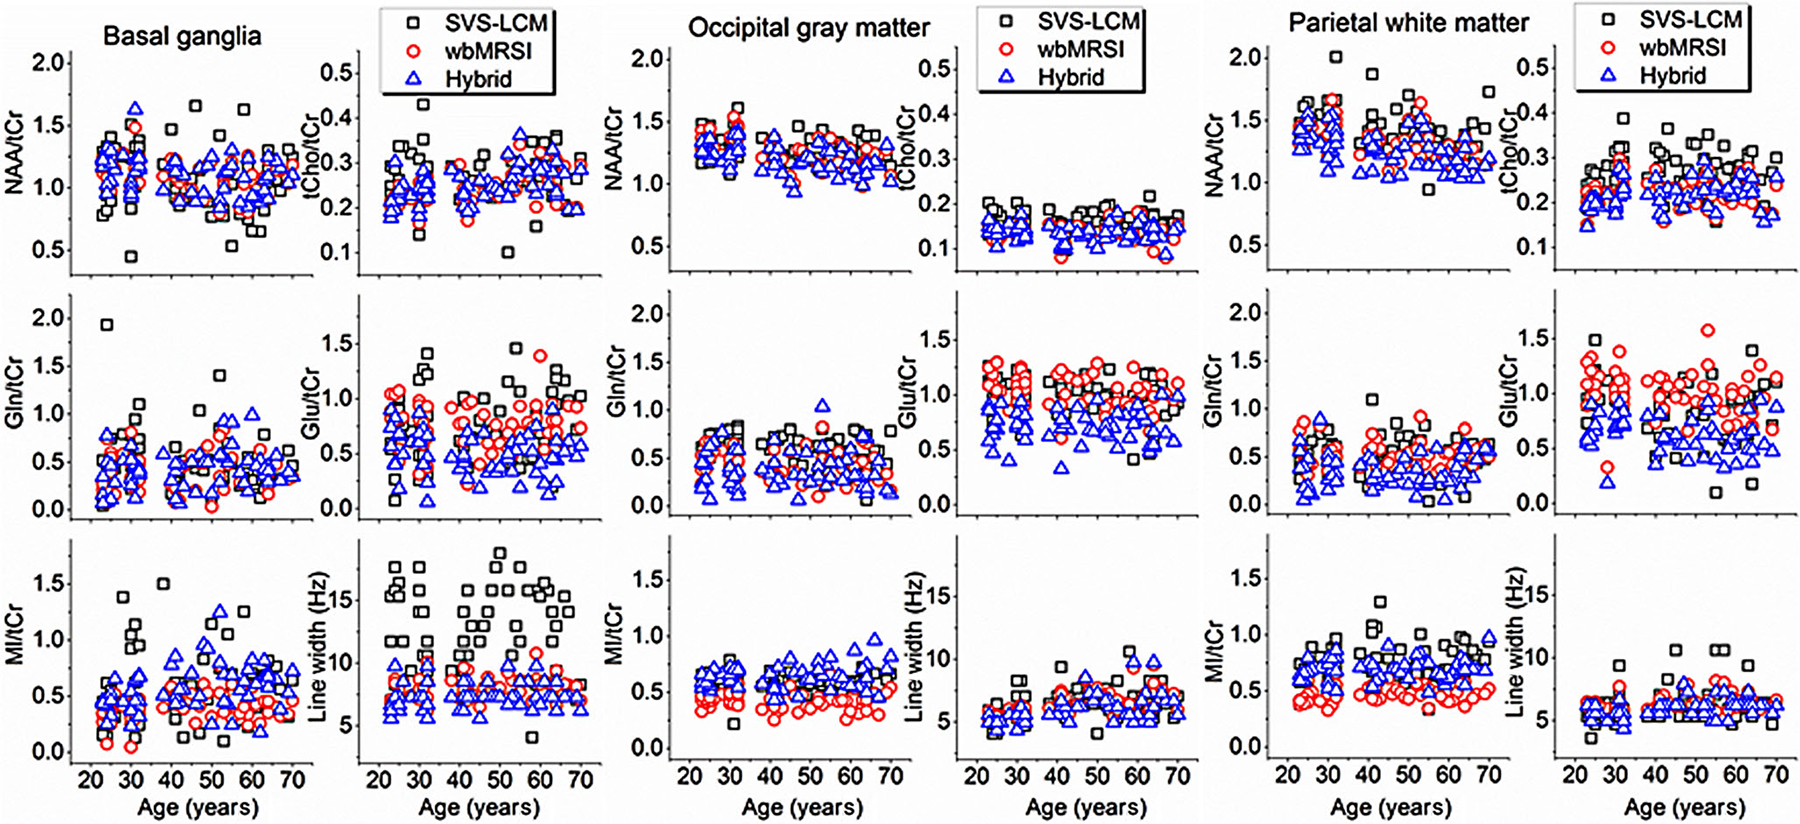
Fig. 4.

Regional metabolite concentrations of NAA/tCr, tCho/tCr, Gln/tCr, Glu/tCr, and MI/tCr, and spectral line widths at each ROI plotted against age, which were measured with SVS and analyzed with the LCModel (indicated as SVS-LCM), wbMRSI and analyzed with MIDAS (indicated as wbMRSI), and wbMRSI and analyzed with LCModel (indicated as hybrid)
