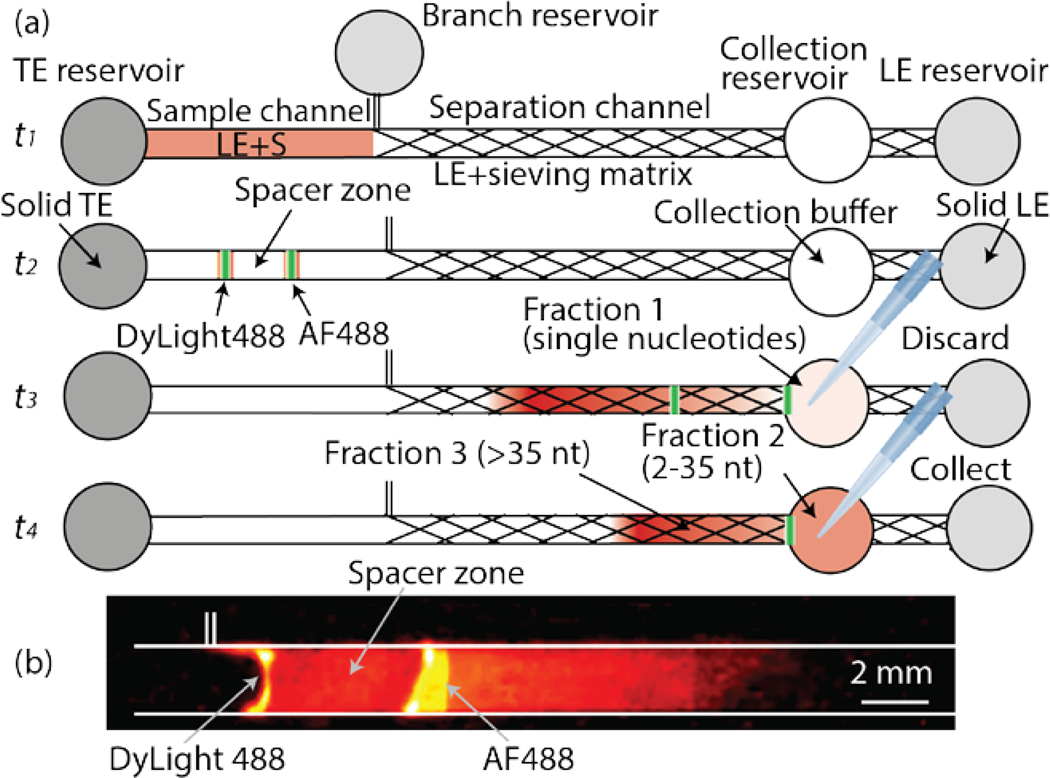
Figure 1.
(a) Schematic representation of RNA size-selection. Initially, the chip is loaded with LE including sample (S) in the sample section of the channel and LE including sieving matrix in the separation channel (time t1). At time t2, an electrical current of 300 μA is applied to the main channel and a 30 μA current is applied in the branch channel. The spacer zone forms between ITP peaks of the two fluorescent dyes. At time t3, the first peak arrives at the collection reservoir. Fraction 1 collected from the collection reservoir contains single nucleotides and is discarded. The reservoir is refilled with fresh collection buffer and the same current is applied again. At time t4, the second peak arrives and Fraction 2 containing the target size RNAs is collected. Longer RNA molecules remain in the channel (Fraction 3). (b) Visualization of the two ITP peaks separated by a spacer zone. The first peak is visualized by AF488 and includes single nucleotides. In the second peak, DyLight488 and RNA in the target range of 2 – 35 nt co-focus. The snapshot was captured from Video S1 at 3:20 s.

