. 2020 Jun 4;9:e48730. doi: 10.7554/eLife.48730

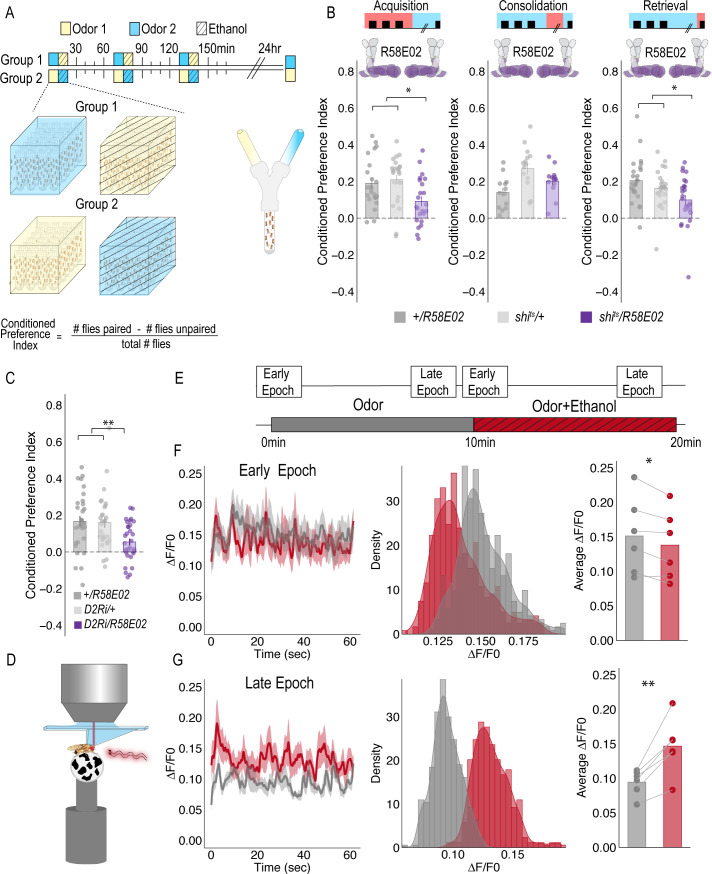
Figure 1. PAM DANs are necessary for encoding alcohol-associated preference.

(A) Schematic illustrating odor condition preference paradigm. Vials of 30 flies are presented with three sessions of 10 min of an unpaired odor, followed by 10 min of a paired odor plus intoxicating vaporized ethanol. To control for odor identity, reciprocal controls were used. Flies were tested 24 hr later in a standard Y maze (B) PAM dopaminergic neurons activity is necessary during acquisition (F(2, 66)=5.355, p=0.007) and retrieval (F(2,71)=5.707, p=0.005), but not consolidation. Bar graphs illustrate mean +/- standard error of the mean. Raw data are overlaid on bar graphs. Each dot is an n of 1, which equals approximately 60 flies (30 per odor pairing). One-way ANOVA with Tukey Posthoc was used to compare mean and variance. *p<0.05 (C) RNAi knockdown of D2R within the PAM population targeted using the R58E02 GAL4 driver significantly reduced alcohol-associated preference F(2,89)=6.441, p=0.002. (D) Schematic illustrating calcium imaging paradigm. (E) Flies are exposed to odor followed by odor plus intoxicating vaporized ethanol while resting or walking on a ball. We used the same odor for both conditions so we could better compare circuit dynamics in response to ethanol and control for odor identity. Fluorescence was captured for 61 s recording epochs that were equally spaced by 2 min. (F). Average traces recorded during early odor and odor plus ethanol exposures. Middle panels illustrate the binned ΔF/F0 and highlights a change in calcium dynamics as a consequence of ethanol exposure. Right panels illustrate the average ΔF/F0 for each fly in each condition. Early Epochs of odor plus ethanol had significantly lower signal (F(1,5)=8.705, p=0.03). (G) Average traces recorded during late odor and odor plus ethanol exposures. Middle panels illustrate the binned ΔF/F0 and highlights a change in calcium dynamics as a consequence of ethanol exposure. Right panels illustrate the average ΔF/F0 for each fly in each condition. Late Epochs of odor plus ethanol had significantly higher signal (F(1,5)=24.177, p=0.004). Within Subject Repeated Measures ANOVA was used to compare mean and variance across condition and time. Scale bar = 50 μm *p<0.05 **p<0.01.

Figure 1.

Figure 1—figure supplement 1. Although inactivation of PAM neurons increased group flies in an open field arena (n = 15), it did not affect alcohol induced activity suggesting that a decrease in preference is encoded independently from the amount of activity animals exhibit while intoxicated (Figure 1G).

Figure 1—figure supplement 1.

(A) Schematic of flyGrAM. Groups of ten male flies were placed into four behavioral chambers. Flies were exposed to five minutes of air, following by ten minutes of ethanol, and lastly 5 min of air. Group activity of flies was recorded at 33 frames per second. (B) Group activity counts were binned over 10 s periods, averaged across biological replicates of 10 flies each (n = 15) and plotted against time. Ethanol was delivered over a 10 min period starting at 300 s as denoted by the gray shaded region. Lines depict mean +/- standard error. Repeated Measures ANOVA with planned contrasts at baseline, early ethanol, late ethanol, and recovery indicated a significant interaction between groups and treatment (F(3.38, 76)=16.21, p=0.00). Mauchly’s test indicated that the assumption of sphericity had been violated (X2(5)=90.51, p=0.00), therefore multivariate tests are reported (ε=0.563). All Posthoc analyses were performed with Bonferroni corrections. (C) Group activity responses of shits/R58E02 were significantly higher during baseline as compared to genetic controls (p=0.000) (D) Group activity responses of shits/R58E02 during early ethanol (first 5 min) was not significantly different from both genetic controls. (E) Group activity responses of shits/R58E02 during late ethanol (last 5 min) was not significantly different from both genetic controls (F). Group activity responses of shits/R58E02 during recovery were not significantly different for genetic controls *p<0.05, **p<0.01.
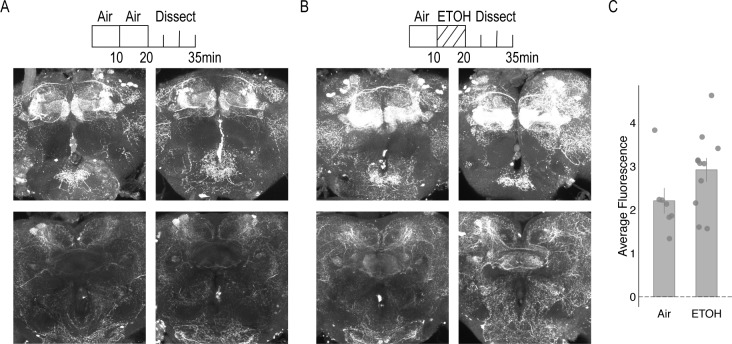
Figure 1—figure supplement 2. Dopamine staining within the brain following 10 min of air or 10 min of ethanol.

Figure 1—figure supplement 2.

(A) Air condition: Flies were habituated for 10 min in the behavior box followed by an additional 10 min of air and dissected immediate after. (B) Ethanol condition: Flies were habituated for 10 min in the behavior box followed by 10 min of ethanol. In both conditions, the top panel illustrates staining with the MB. Maximum intensity z stacks were collected from the start of the gamma lobe to the end of the α/β, α`β` lobes. Each stack consists of approximately 20 µm slices. Bottom panel illustrates staining within the central complex, predominately the FSB. Maximum intensity z stacks were collected from the start of the EB to the end of the FSB. Each stack consists of approximately 20 1 um slices. (C) Air and ethanol conditions did not significantly affect average dopamine fluorescence F(1,16)=2.947, p=0.105. Bar graphs illustrate mean +/- standard error of the mean. Raw data are overlaid on bar graphs. Each dot is one fly. One-way ANOVA was used to compare mean and variance.
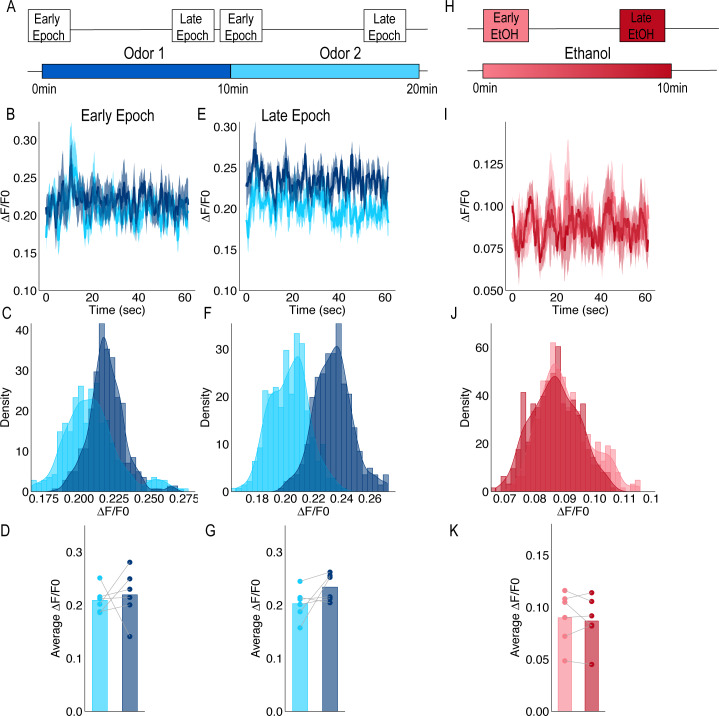
Figure 1—figure supplement 3. Calcium Imaging from terminals of PAM population of DANs in response to odors and ethanol.

Figure 1—figure supplement 3.

(A) Schematic of odor presentation. Flies were presented with one odor for 10 min followed by a second odor for an additional 10 min. Isoamyl acetate and isoamyl alcohol were used as odors and order was counterbalanced across animals. Images were captured for a total of 60 s during Early and Late Epochs. (B) Traces of response to Odor one and Odor two during the Early Epochs. (C) Histograms of the frequency of delta F/F0 during the Early Epoch (D) Comparison of average response to Odor one and Odor two during Early Epochs for each animal (n = 6) were not significantly different. Repeated measure ANOVA was used to compare mean and variance F(1,5)=0.144, p=0.720. (E) Traces of response to Odor one and Odor two during the Late Epochs. (F) Histograms of the frequency of delta F/F0 during the late Epoch. (G) Comparison of average response to Odor one and Odor two during Late Epochs for each animal (n = 6). Repeated measure ANOVA was used to compare mean and variance F(1,5)=3.437, p=0.123. (H) Schematic of 50% ethanol presentation. Images were captured for the entire 10 min, however, to remain consistent with other recording paradigms, only 60 s during Early and Late time points were analyzed. (I) Traces of response to ethanol during Early and Late Epochs. (J) Histograms of the frequency of delta F/F0 during the Early and Late Epochs. (K) Comparison of average response during Early and Late Epochs of ethanol were not significantly different. Repeated measure ANOVA was use to compare mean and variance F(1,5)=0.390, p=0.560.
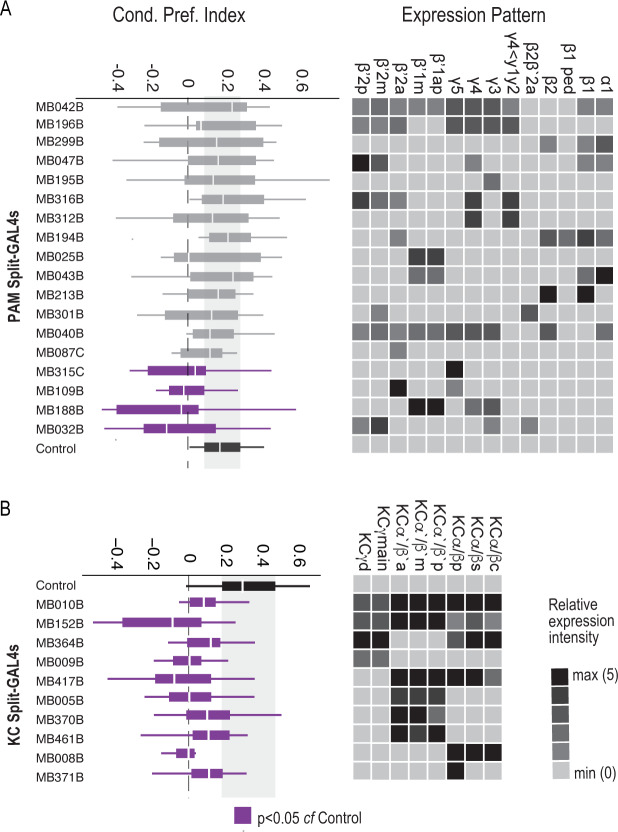
Figure 1—figure supplement 4. Requirement of PAM DANs and Kenyon cells in formation of alcohol-associated preference.

Figure 1—figure supplement 4.

(A) Inactivation of subsets of PAM DANs during both acquisition and retrieval resulted in significant decreases in preference for alcohol associated cues χ2(18)=30.81, p=0.03. Four of the 18 specific PAM Split-GAL4 lines which predominately express in the medial aspect of the MB resulted in significant decreases as compared to control lines (MB315C, MB109B, MB188B, and MB032B). (b) Inactivation of subsets of Kenyon cells during both acquisition and retrieval using 10 specific Kenyon cell Split-GAL4 lines. All 10 lines resulted in significant decreases in preference for alcohol associated cues. χ2(10)=27.97, p=0.002. Kruskal Wallis was used to compare mean and variance with Dunnett’s Posthoc test compared to control. Purple fill indicates p<0.05.
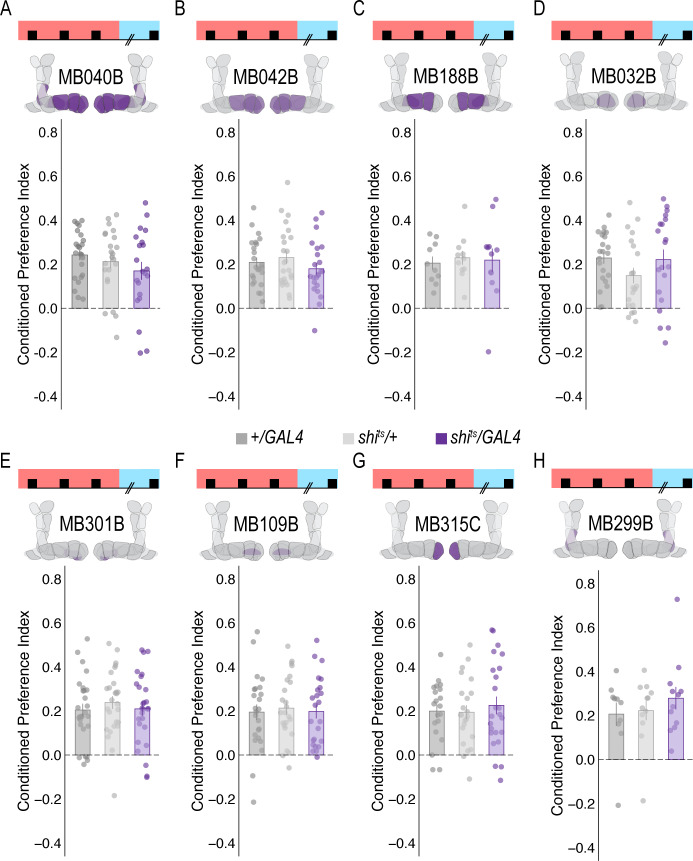
Figure 1—figure supplement 5. Subsets of PAM DANs are dispensable for encoding alcohol-associated preference.

Figure 1—figure supplement 5.

(A–H) Using thermogenetics to inactivate neurotransmission during acquisition in dopaminergic neurons with varying expression patterns did not disrupt alcohol-associated preference. Split-Gal4 lines tested are ordered by MB innervation patterns. Bar graphs illustrate mean +/- standard error of the mean. Raw data are overlaid on bar graphs. Each dot is an n of 1, which equals approximately 60 flies (30 per odor pairing). One-way ANOVA was used to compare mean and variance.
Figure 1—figure supplement 6. Subsets of PAM DANs are required for retrieval, but not acquisition or consolidation.
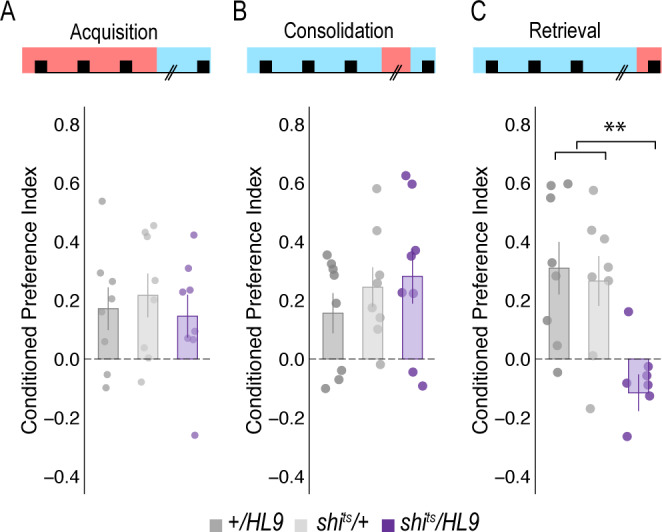
Figure 1—figure supplement 6.

(A) Inactivating subsets of PAM neurons during acquisition using the HL9-GAL4 driver, which is not a split-GAL4 line, did not disrupt alcohol associated preference (Claridge-Chang et al., 2009) F(2,21)=0.24, p=0.788. (B) Inactivating subsets of PAM neurons during consolidation, defined as the overnight period between acquisition and retrieval did not disrupt alcohol associated preference F(2,21)=0.698, p=0.509. (C) However, inactivating the same subsets of PAM DANs during retrieval significantly disrupted alcohol associated preference F(2,21)=8.596, p=0.002. Bar graphs illustrate mean +/- standard error of the mean. Raw data are overlaid on bar graphs. Each dot is an n of 1, which equals approximately 60 flies (30 per odor pairing). One-way ANOVA was used to compare mean and variance. **p<0.01.
Figure 1—figure supplement 7. mRNA quantification of dopamine receptors (DRs) in all neurons following constitutive expression of DR-RNAi's.
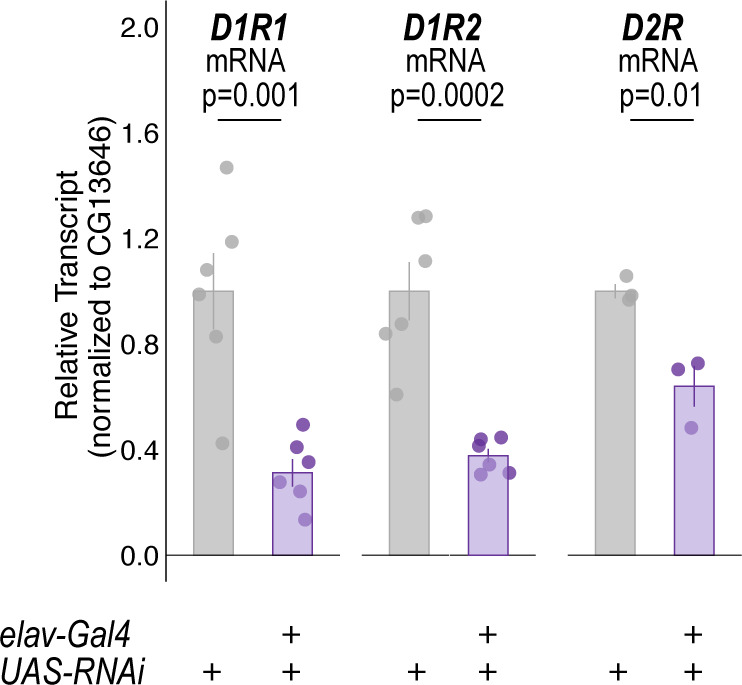
Figure 1—figure supplement 7.

Quantitative RT-PCR on whole heads of flies expressing respective dopamine receptor RNAi with pan-neuronal elav-Gal4. Bar graphs illustrate mean +/- standard error of the mean. Raw data are overlaid on bar graphs. One-way ANOVA was used to compare mean and variance with Tukey Posthoc comparing control to experimental for each RNAi experiment.
Figure 1—figure supplement 8. Temperature controls for DAN inhibition experiments that showed decreases in retrieval of alcohol associated preference at the restrictive temperature.
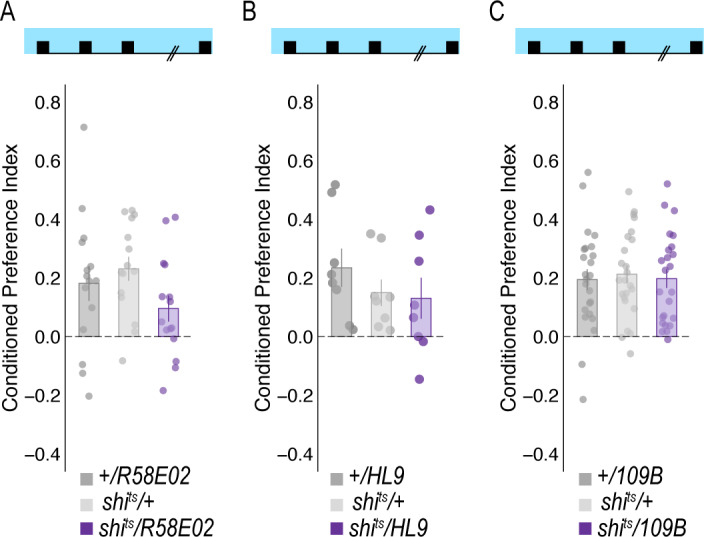
Figure 1—figure supplement 8.

Flies were trained and tested at permissive temperatures (20°C) and exhibited normal alcohol associated preference for pair odor cues under these conditions.