
Figure 5. eRF1 is Redistributed in Postmortem C9-ALS Tissue.
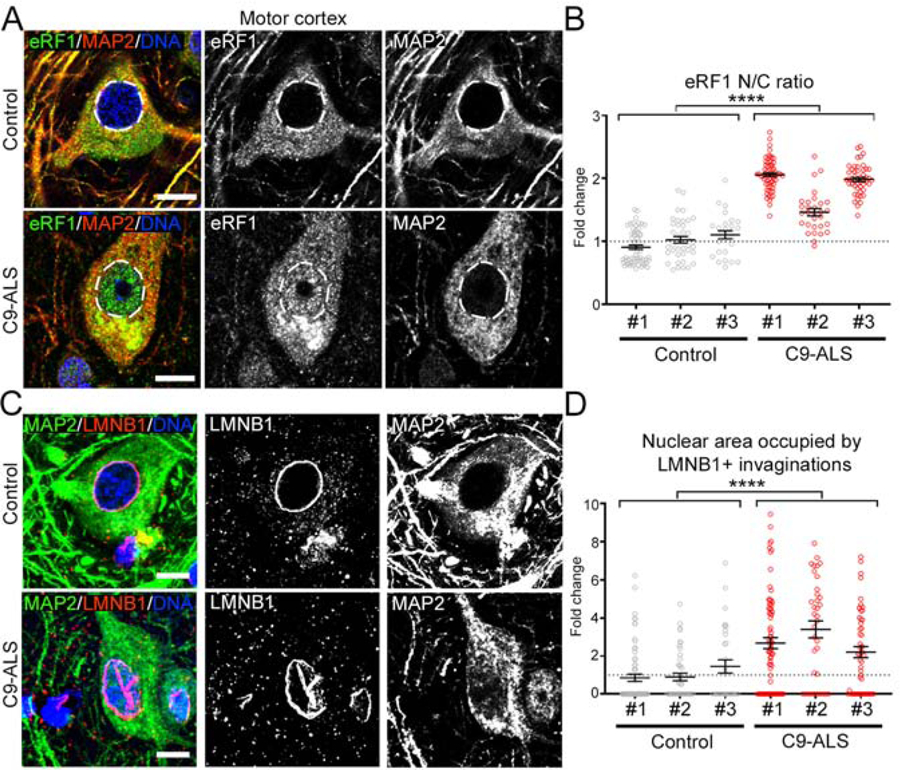
(A) Representative IHC confocal images of layer V neurons immunolabeled for eRF1 (green), MAP2 (red) and DNA (blue) in motor cortex tissue from non-neurological controls and C9-ALS patients. Dashed lines mark the nuclear boundary.
(B) Dot plot displaying the fold change in the N/C ratio of eRF1 signal observed in cortical neurons of 3 non-neurological age-matched controls and 3 C9-ALS patients. Mann-Whitney U test.
(C) Representative IHC confocal images of layer V neurons immunolabeled for LMNB1(red), MAP2 (green), and DNA (blue) in motor cortex tissue from non-neurological controls and C9-ALS patients.
(D) Dot plot displaying the fold change in the nuclear area occupied by LMNB1+ invaginations in cortical neurons of 3 non-neurological age-matched controls and 3 C9-ALS patients. Mann-Whitney U test.
In graphs, bars represent mean ± SEM and the dotted lines mark the mean in control samples. Scale bars: 10 μm.