
Figure 6. Protein Translation and mRNA Degradation Through NMD in C9-HRE Expressing Cells.
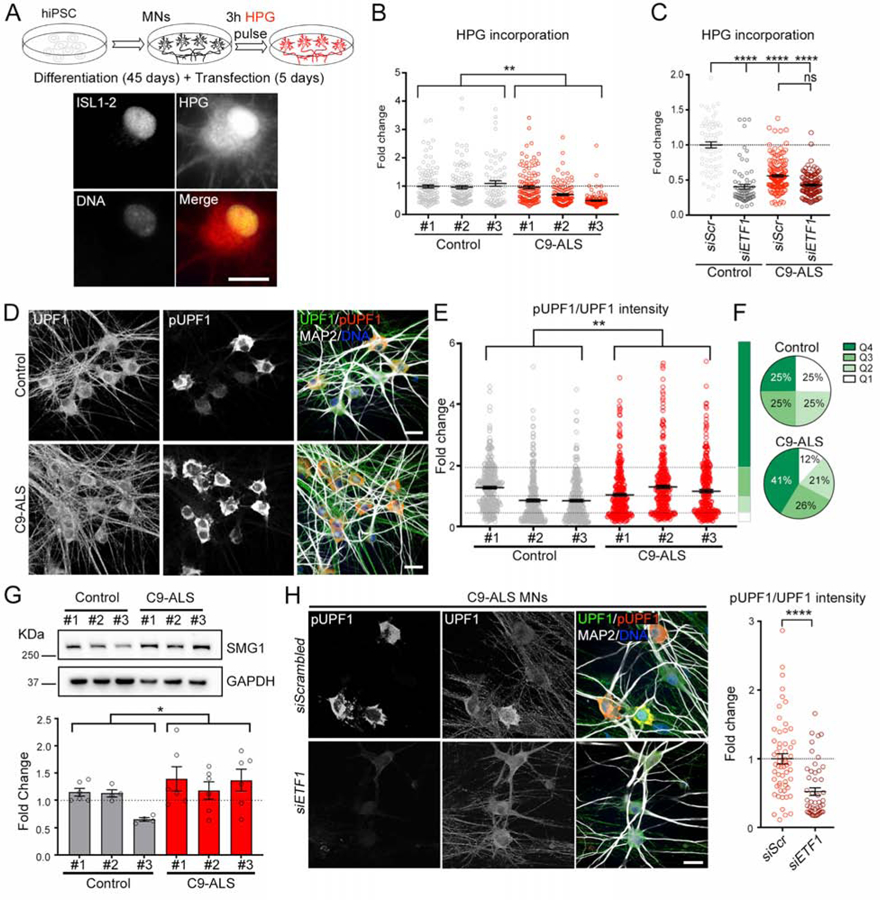
(A) Top: schematic of de novo protein translation assay performed in iPSC-derived MNs. Bottom: representative image of HPG fluorescent labeling of de novo protein synthesis in an ISL1–2+ MN.
(B) Dot plot displaying the level of HPG incorporation in MNs derived from 3 control and 3 C9-ALS iPSC lines. Kruskal-Wallis test.
(C) Dot plot displaying the level of HPG incorporation in MNs transfected with scrambled (siScr) or ETF1 siRNAs. MNs derived from 1 control and 2 C9-ALS iPSC lines. Kruskal-Wallis test; ns=not significant.
(D) Representative confocal images of healthy control and C9-ALS patient MNs immunolabeled for total UPF1 (green), pUPF1 (red), and DNA (blue).
(E) Dot plot displaying the fold change in pUPF1/UPF1 signal in control and C9-ALS MNs. (Mann-Whitney U test.
(F) Pie charts displaying NMD activation levels defined by pUPF1/UPF1 quartiles (Q1–4) observed in control (top) and C9 (bottom) MNs.
(G) Top: Representative WB for SMG1 in MN cultures derived from 3 control and 3 C9-ALS iPSC lines. GAPDH was used as a loading control. Bottom: bar plots showing the fold change in the SMG1/GAPDH ratio in control and C9-ALS MN cultures. T test.
(H) Left: Representative confocal images of C9-ALS patient MNs transfected with scrambled or ETF1 siRNAs and immunolabeled for total UPF1 (green), pUPF1 (red), and DNA (blue). Right: dot plot displaying the fold change in pUPF1/UPF1 signal in C9-ALS MNs transfected with scrambled or ETF1 siRNAs. n=3 independent differentiations; Mann-Whitney U test.
In graphs, empty-filled circles represent individual cells (B, C, E, H) or biological replicates (G). Bars represent the mean ± SEM and dotted lines mark the mean level in control samples (B, C, G, H) or Q1–4 quartile limits (E). Scale bars: 25 (D, H), 20 (A) μm.