
Figure 7. C9orf72 mRNA is Targeted for Degradation by NMD.
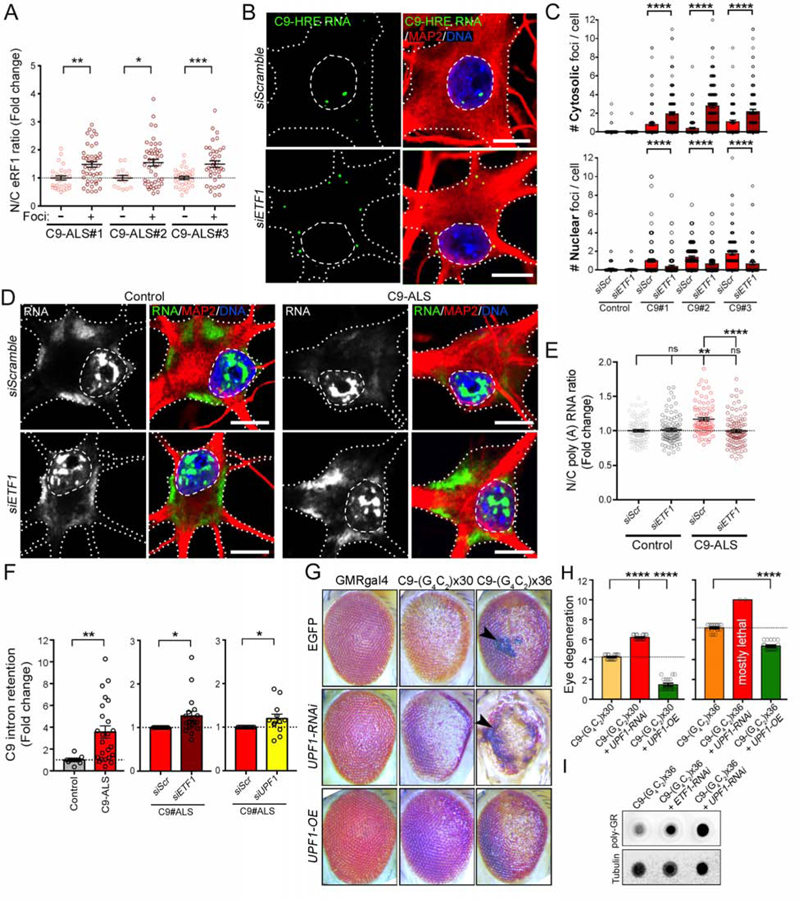
(A) Dot plot displaying the fold change in the N/C ratio of eRF1 signal quantified in C9-ALS MNs with (+) or without (−) C9-HRE RNA foci. n=2 independent differentiations; Mann-Whitney U test; p*<0.05; **<0.01; ***<0.001.
(B) Representative FISH+ICC confocal images of C9-ALS patient MNs transfected with scrambled or ETF1 siRNA and immunolabeled for G4C2 RNA foci (green), MAP2 (red) and DNA (blue). Dashed lines mark the nuclear boundary and dotted lines mark the neuronal soma.
(C) Bar plots showing the number of nuclear (bottom) and cytosolic (top) C9-HRE RNA foci per cell in MNs derived from 1 control and 3 C9-ALS iPSC lines, transfected with scrambled or ETF1 siRNAs. Wilcoxon signed rank.
(D) Representative FISH+ICC confocal images of healthy control and C9-ALS patient MNs transfected with scrambled or ETF1 siRNAs, and immunolabeled for poly(A) RNA (green), MAP2 (red) and DNA (blue). Dashed lines mark the nuclear boundary and dotted lines mark the neuronal soma.
(E) Dot plot showing the N/C ratio of poly(A) RNA in control and C9-ALS MNs transfected with scrambled or ETF1 siRNAs. n=2 independent differentiations; Kruskal-Wallis test, p=ns: not significant; **<0.01, ****<0.0001;.
(F) Left graph: Bar plots showing fold change in the level of C9orf72-intron retention in MN cultures derived from 3 control and 3 C9-ALS iPSC lines as measured by semi-quantitative RT-PCR. Bar plots comparing intron retention in C9-ALS MNs transfected with scrambled (Scr) vs. ETF1 (middle graph) or vs. UPF1 (right graph) siRNAs. Mann-Whitney (left and right graphs), and t test (middle graph).
(G) Representative images of fly eyes from wild-type (GMR-GAL4 x EGFP) or C9-HRE (C9×30 or x36) mutant flies, with endogenous levels (EGFP), knockdown (UPF1-RNAi) or overexpression (UPF1-OE) of UPF1. Arrow heads indicate the presence of necrotic patches.
(H) Bar plots displaying the level of eye degeneration in flies carrying C9-HRE (C9×30 or x36 repeats) with endogenous levels, knockdown (UPF1-RNAi) or overexpression (UPF1-OE) of UPF1. The basal level of eye degeneration in C9×30 or x36 flies is shown in yellow and orange respectively; suppression and enhancement of C9-HRE toxicity is shown in green and red, respectively. Mann-Whitney U test.
(I) Dot blot of poly-GR in C9×36, and C9×36 flies with decreased eRF1 (ETF1-RNAi) or UPF1 (UPF1-RNAi). Tubulin was used as a loading control.
In graphs, empty-filled circles represent individual cells (A, C, E), biological replicates (F) or analyzed flies (H). Bars represent the mean ± SEM, and dotted lines mark the mean levels in control/reference samples. Scale bars: 10 μm.