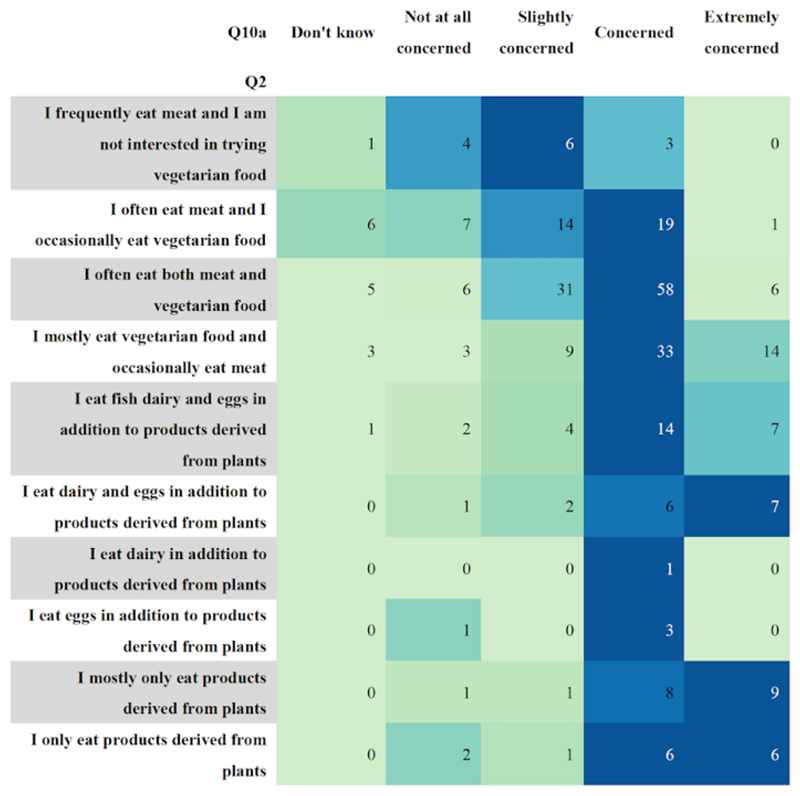
Figure 7.
A colour-coded table that shows the relation between the type of diet people say they follow, and their level of concern for the environment. There are 312 survey responses illustrated in the figure. Vegans made up 4.5%, 95% CI (2.3%, 6.7%) of respondents, vegetarians 13.2%, 95% CI (9.4%, 17%), pescatarians 9.2%, 95% CI (6.1%, 12.3%), flexitarians 54.4%, 95% CI (47.71%, 61.1%) and meat eaters 18.8%, 95% CI (15.4%, 22.2%) of respondents.

