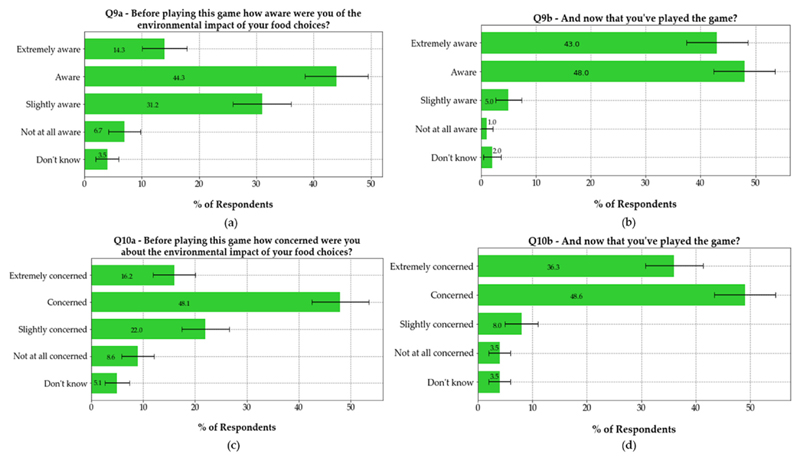
Figure 9.
Levels of awareness (upper) and concern (lower) about environmental impacts of people’s food choices before (left) and after (right) playing the online game. The bars and values written on the bars indicate the percentage of people who selected a particular response. In the figure, 95% confidence intervals are shown.

