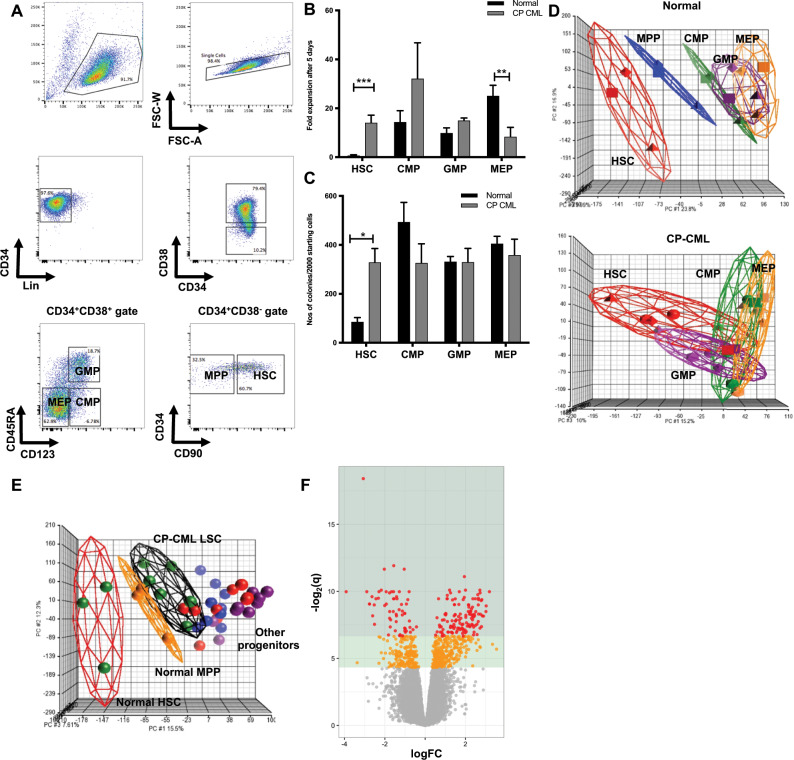
Fig. 1. CML LSCs are more proliferative than normal HSCs.
a A representative sorting strategy of CP-CML samples is depicted. b Fold expansion after 5 days (mean ± standard deviation) are shown (**p < 0.01; ***p < 0.001). c Colony counts are represented (mean ± standard deviation) per 2000 starting cells to allow comparison between groups (*p < 0.05). d Principal component analysis (PCA) of the gene expression profiles from GSE47927 was used to identify global differences between normal and CP-CML. An individual point within the axes represents each microarray and each subpopulation grouping by a different color. Separate PCAs of normal and CP-CML subpopulations. e PCA of normal and CP samples overlapped. f A volcano plot from the same dataset showing the deregulation of genes in a comparison of Lin−CD34+CD38−CD90+ cells from six CP-CML samples compared with three normal samples (GSE47927). Areas of significance are indicated by a dark green (equivalent to q ≤ 0.01) or light green (equivalent to q ≤ 0.05) background. Genes reaching significance are colored red (q ≤ 0.01) or orange (q ≤ 0.05); non-significant genes are gray.

