
Fig. 2. Validation and specificity of TR3-56 cell predictive role.
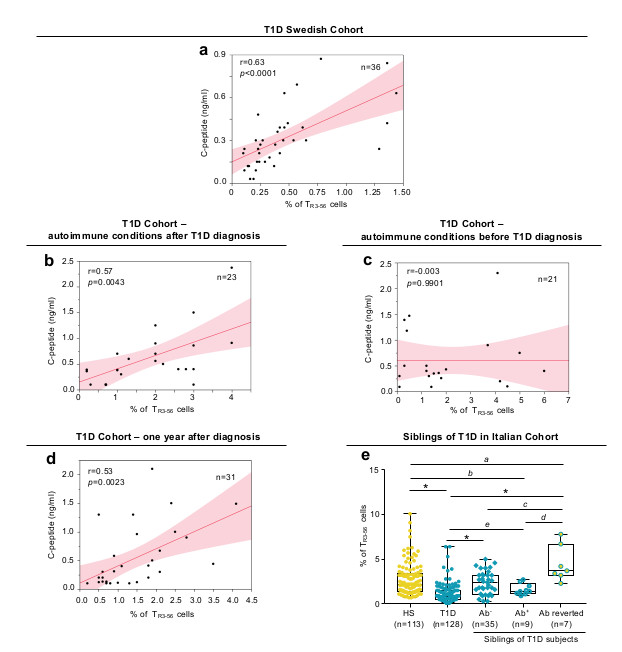
a, Scatter plot showing positive correlation between the frequency of circulating TR3-56 cells and serum levels of fasting C-peptide in a validation cohort (Swedish cohort) of T1D children (n=36) at disease onset; r=0.63, p<0.0001 by two-tailed Pearson's correlation. Red line indicates regression line and shading indicates confidence interval. b, Scatter plot showing positive correlation between the frequency of circulating TR3-56 cells and serum levels of fasting C-peptide in a cohort of T1D children that developed other autoimmune conditions after T1D diagnosis (n=23); r=0.57, p=0.0043 by two-tailed Pearson's correlation. Red line indicates regression line and shading indicates confidence interval. c, Scatter plot showing the absence of statistical correlation between the frequency of circulating TR3-56 cells and serum levels of fasting C-peptide in children (n=21) that at T1D diagnosis were already affected by other autoimmune conditions (CD or AIT); r=-0.003, p=0.9901 by two-tailed Pearson's correlation. Red line indicates regression line and shading indicates confidence interval. d, Scatter plot showing positive correlation between the frequency of circulating TR3-56 cells and serum levels of fasting C-peptide in T1D subjects one year after diagnosis (Italian cohort) (n=31); r=0.53, p=0.0023 by two-tailed Pearson's correlation. Red line indicates regression line and shading indicates confidence interval. e, Box plot indicates the frequency of TR3-56 cells in healthy subjects (n=113), T1D children at diagnosis (n=128) and in 51 at-risk siblings of T1D individuals: 35 autoantibody negative (Ab-), 9 autoantibody positive (Ab+) and 7 autoantibody positive reverted to autoantibody negative (Ab reverted) subjects. Data are presented as box plots (min, max, median, and 25th and 75th percentiles), each dot represents a individual subjects. ap=0.0084; bp=0.0456; cp=0.006; dp=0.0007; ep=0.0106; *p<0.0001 by two-tailed Mann-Whitney U-test.