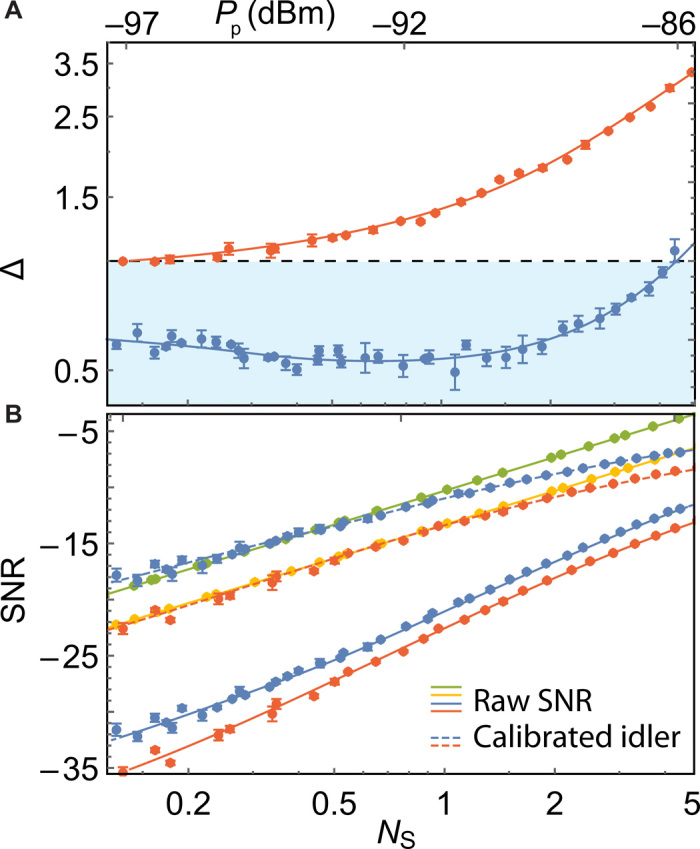
Fig. 2. Entanglement and QI.

(A) The measured entanglement parameter Δ for the output of the JPC (blue) and classically correlated noise (orange) as a function of the inferred signal photon number NS at the output of the JPC and the pump power Pp at the input of the JPC. (B) Comparison of the measured single-mode signal-to-noise ratio (SNR) of QI (solid blue), symmetric classically correlated illumination (CI, solid orange), coherent-state illumination with homodyne (solid green) and heterodyne detection (solid yellow), and the inferred SNR of calibrated QI (dashed blue) and CI (dashed orange) as a function of the signal photon number NS for a perfectly reflective object and a 5-μs measurement time. The dots are measured and inferred data points, and the solid and dashed lines are the theory prediction. For both (A) and (B), the error bars indicate the 95% confidence interval based on three sets of measurements, each with 380,000 two-channel quadrature pairs for QI/CI, and 192,000 quadrature pairs for coherent-state illumination.
