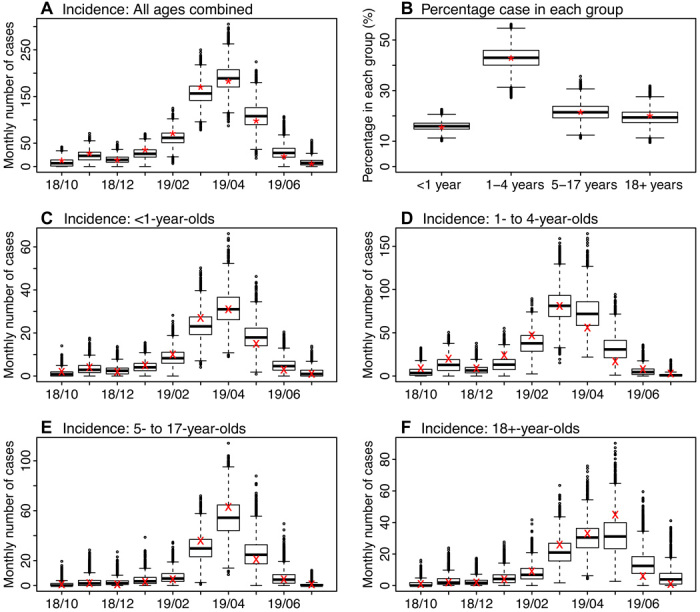
Fig. 2. Model fit.

Box plots show estimates of monthly incidence for all ages (A), percentage of cases reported in each age group (B), and monthly incidence for <1-year-olds (C), 1- to 4-year-olds (D), 5- to 17-year-olds (E), and 18+-year-olds (F). Results are pooled over all 10 model inference runs (each with 10,000 and in total 100,000 model realizations). Horizontal thick lines show the median of model estimates; box edges show the 25th and 75th percentiles; whiskers show the 2.5th and 97.5th percentiles; and dots show outliers. Stars (*) in (A) and (B) show monthly incidence for all ages and the age distribution, reported as of 6 August 2019; crosses (×) in (C) to (F) show age-grouped monthly incidence estimated from health reports. The x axis shows time in month (yy/mm).
