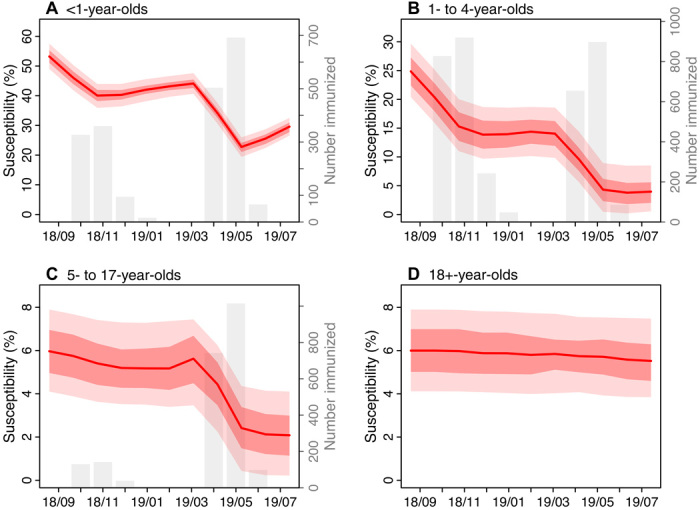
Fig. 3. Estimated changes in population susceptibility.

Red lines and surrounding regions (y axis on the left) show the mean and 50 and 95% CrIs of estimates pooled over all 10 model inference runs (100,000 model realizations in total) for <1-year-olds (A), 1- to 4-year-olds (B), 5- to 17-year-olds (C), and 18+-year-olds (D), respectively, at the end of each month from September 2018 to July 2019. The initial susceptibilities, estimated at the end of September 2018, were computed by adding the total numbers of individuals immunized by the vaccination campaigns in October 2018 to the posterior estimates at the end of October 2018. For comparison, the gray bars (y axis on the right) show estimated numbers of individuals immunized during the vaccination campaigns; note that the vaccination campaigns targeted individuals under 19 years and thus is not shown for 18+-year-olds.
