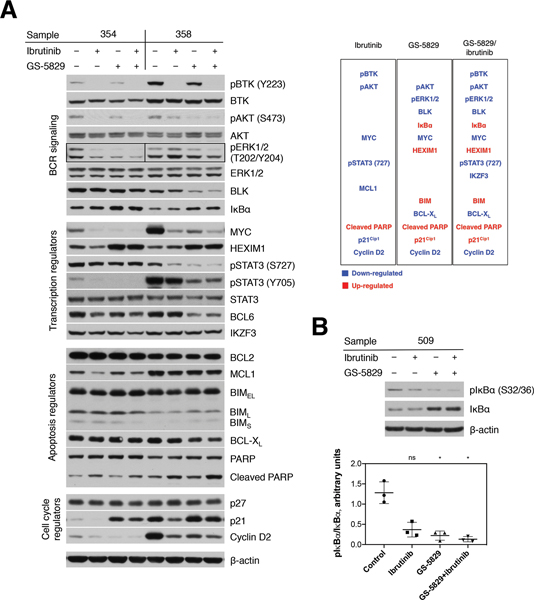
Figure 4. GS-5829 changes the levels of multiple proteins in CLL.
(A) Displayed are representative Western blot analyses of 2 CLL samples in NLC co-culture after 24 hours of treatment with GS-5829, ibrutinib, or both, as indicated on top of the blots. The functional categorization for each signaling molecule is shown on the left-hand side. A list of proteins that were significantly down- (blue) or up-regulated (red) by GS-5829 and ibrutinib (N=7) is presented on the right-hand side. (B) A representative Western blot analysis of the pIκBα (S32/36) and IκBα levels in a CLL sample after 24 hours of treatment and the pIκBα/IκBα ratio as measured by densitometry in 3 CLL samples.

